Immigrants from Netherlands vs Immigrants from Eastern Africa Unemployment
COMPARE
Immigrants from Netherlands
Immigrants from Eastern Africa
Unemployment
Unemployment Comparison
Immigrants from Netherlands
Immigrants from Eastern Africa
4.9%
UNEMPLOYMENT
99.0/ 100
METRIC RATING
60th/ 347
METRIC RANK
5.1%
UNEMPLOYMENT
88.1/ 100
METRIC RATING
128th/ 347
METRIC RANK
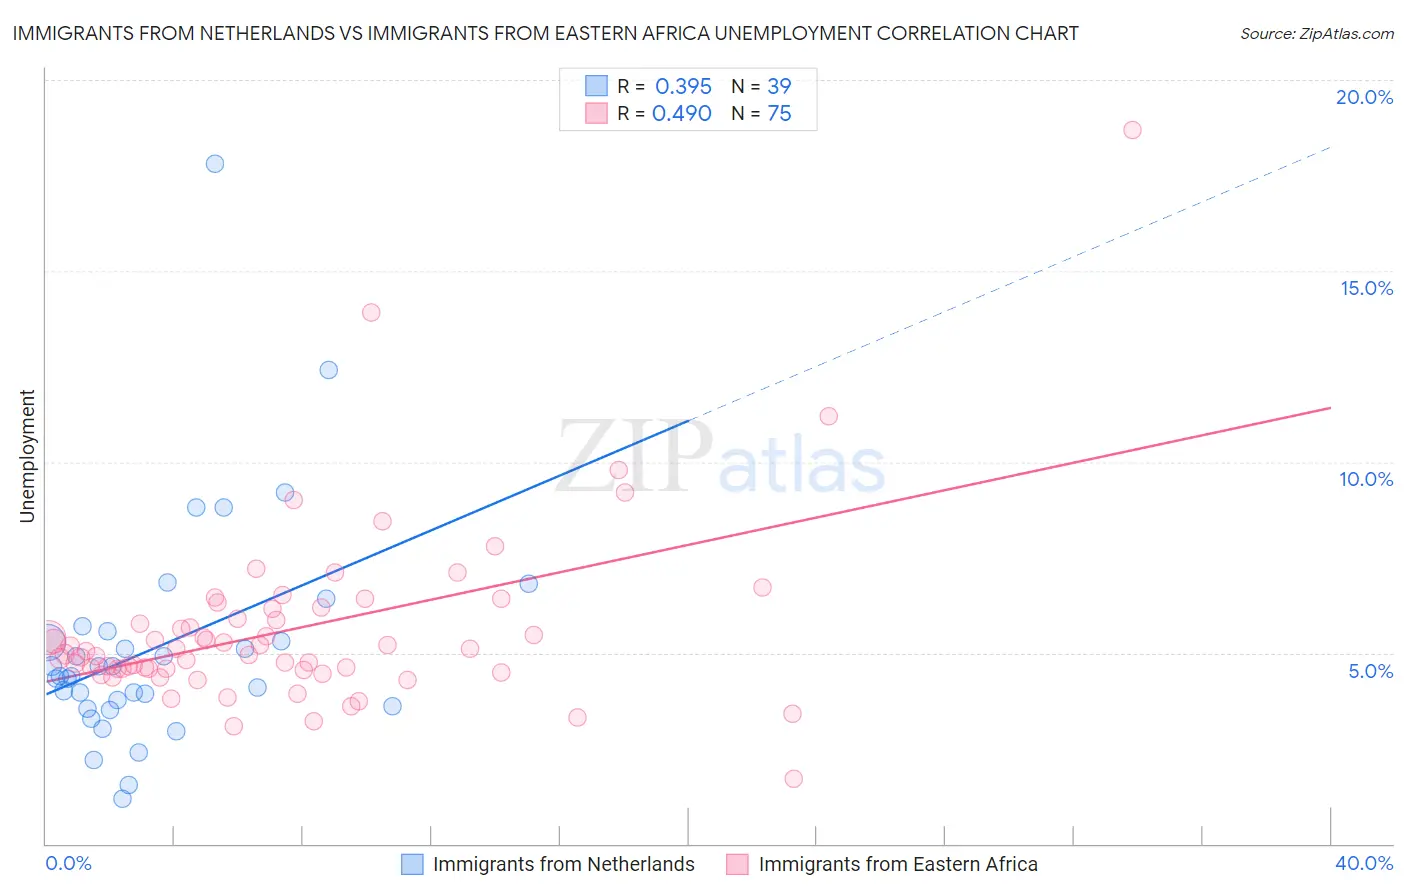
Immigrants from Netherlands vs Immigrants from Eastern Africa Unemployment Correlation Chart
The statistical analysis conducted on geographies consisting of 237,753,486 people shows a mild positive correlation between the proportion of Immigrants from Netherlands and unemployment in the United States with a correlation coefficient (R) of 0.395 and weighted average of 4.9%. Similarly, the statistical analysis conducted on geographies consisting of 354,902,578 people shows a moderate positive correlation between the proportion of Immigrants from Eastern Africa and unemployment in the United States with a correlation coefficient (R) of 0.490 and weighted average of 5.1%, a difference of 4.2%.
Unemployment Correlation Summary
| Measurement | Immigrants from Netherlands | Immigrants from Eastern Africa |
| Minimum | 1.2% | 1.7% |
| Maximum | 17.8% | 18.7% |
| Range | 16.6% | 17.0% |
| Mean | 5.2% | 5.6% |
| Median | 4.4% | 5.0% |
| Interquartile 25% (IQ1) | 3.6% | 4.6% |
| Interquartile 75% (IQ3) | 5.6% | 6.1% |
| Interquartile Range (IQR) | 2.0% | 1.6% |
| Standard Deviation (Sample) | 3.0% | 2.4% |
| Standard Deviation (Population) | 3.0% | 2.4% |
Similar Demographics by Unemployment
Demographics Similar to Immigrants from Netherlands by Unemployment
In terms of unemployment, the demographic groups most similar to Immigrants from Netherlands are Cambodian (4.9%, a difference of 0.0%), Icelander (4.9%, a difference of 0.010%), Immigrants from Bulgaria (4.9%, a difference of 0.030%), Bhutanese (4.9%, a difference of 0.050%), and Greek (4.9%, a difference of 0.070%).
| Demographics | Rating | Rank | Unemployment |
| Immigrants | Zimbabwe | 99.2 /100 | #53 | Exceptional 4.9% |
| Eastern Europeans | 99.2 /100 | #54 | Exceptional 4.9% |
| Australians | 99.2 /100 | #55 | Exceptional 4.9% |
| Celtics | 99.1 /100 | #56 | Exceptional 4.9% |
| Immigrants | Singapore | 99.1 /100 | #57 | Exceptional 4.9% |
| Greeks | 99.0 /100 | #58 | Exceptional 4.9% |
| Bhutanese | 99.0 /100 | #59 | Exceptional 4.9% |
| Immigrants | Netherlands | 99.0 /100 | #60 | Exceptional 4.9% |
| Cambodians | 99.0 /100 | #61 | Exceptional 4.9% |
| Icelanders | 98.9 /100 | #62 | Exceptional 4.9% |
| Immigrants | Bulgaria | 98.9 /100 | #63 | Exceptional 4.9% |
| Italians | 98.9 /100 | #64 | Exceptional 4.9% |
| Immigrants | Canada | 98.8 /100 | #65 | Exceptional 4.9% |
| Slovaks | 98.7 /100 | #66 | Exceptional 4.9% |
| New Zealanders | 98.6 /100 | #67 | Exceptional 4.9% |
Demographics Similar to Immigrants from Eastern Africa by Unemployment
In terms of unemployment, the demographic groups most similar to Immigrants from Eastern Africa are Immigrants from Latvia (5.1%, a difference of 0.0%), Kenyan (5.1%, a difference of 0.020%), Immigrants from Kenya (5.1%, a difference of 0.020%), Immigrants from Eastern Asia (5.1%, a difference of 0.040%), and Ethiopian (5.1%, a difference of 0.090%).
| Demographics | Rating | Rank | Unemployment |
| Lebanese | 89.2 /100 | #121 | Excellent 5.1% |
| Immigrants | Switzerland | 89.1 /100 | #122 | Excellent 5.1% |
| Asians | 89.0 /100 | #123 | Excellent 5.1% |
| Ethiopians | 88.6 /100 | #124 | Excellent 5.1% |
| Immigrants | Eastern Asia | 88.3 /100 | #125 | Excellent 5.1% |
| Kenyans | 88.2 /100 | #126 | Excellent 5.1% |
| Immigrants | Kenya | 88.2 /100 | #127 | Excellent 5.1% |
| Immigrants | Eastern Africa | 88.1 /100 | #128 | Excellent 5.1% |
| Immigrants | Latvia | 88.0 /100 | #129 | Excellent 5.1% |
| Iranians | 86.9 /100 | #130 | Excellent 5.1% |
| Immigrants | Croatia | 86.8 /100 | #131 | Excellent 5.1% |
| Immigrants | Ethiopia | 86.7 /100 | #132 | Excellent 5.1% |
| Immigrants | Jordan | 86.6 /100 | #133 | Excellent 5.1% |
| Immigrants | Europe | 86.3 /100 | #134 | Excellent 5.1% |
| Immigrants | Burma/Myanmar | 86.2 /100 | #135 | Excellent 5.1% |