Immigrants from Laos vs Guyanese Unemployment
COMPARE
Immigrants from Laos
Guyanese
Unemployment
Unemployment Comparison
Immigrants from Laos
Guyanese
5.3%
UNEMPLOYMENT
30.9/ 100
METRIC RATING
194th/ 347
METRIC RANK
6.9%
UNEMPLOYMENT
0.0/ 100
METRIC RATING
322nd/ 347
METRIC RANK
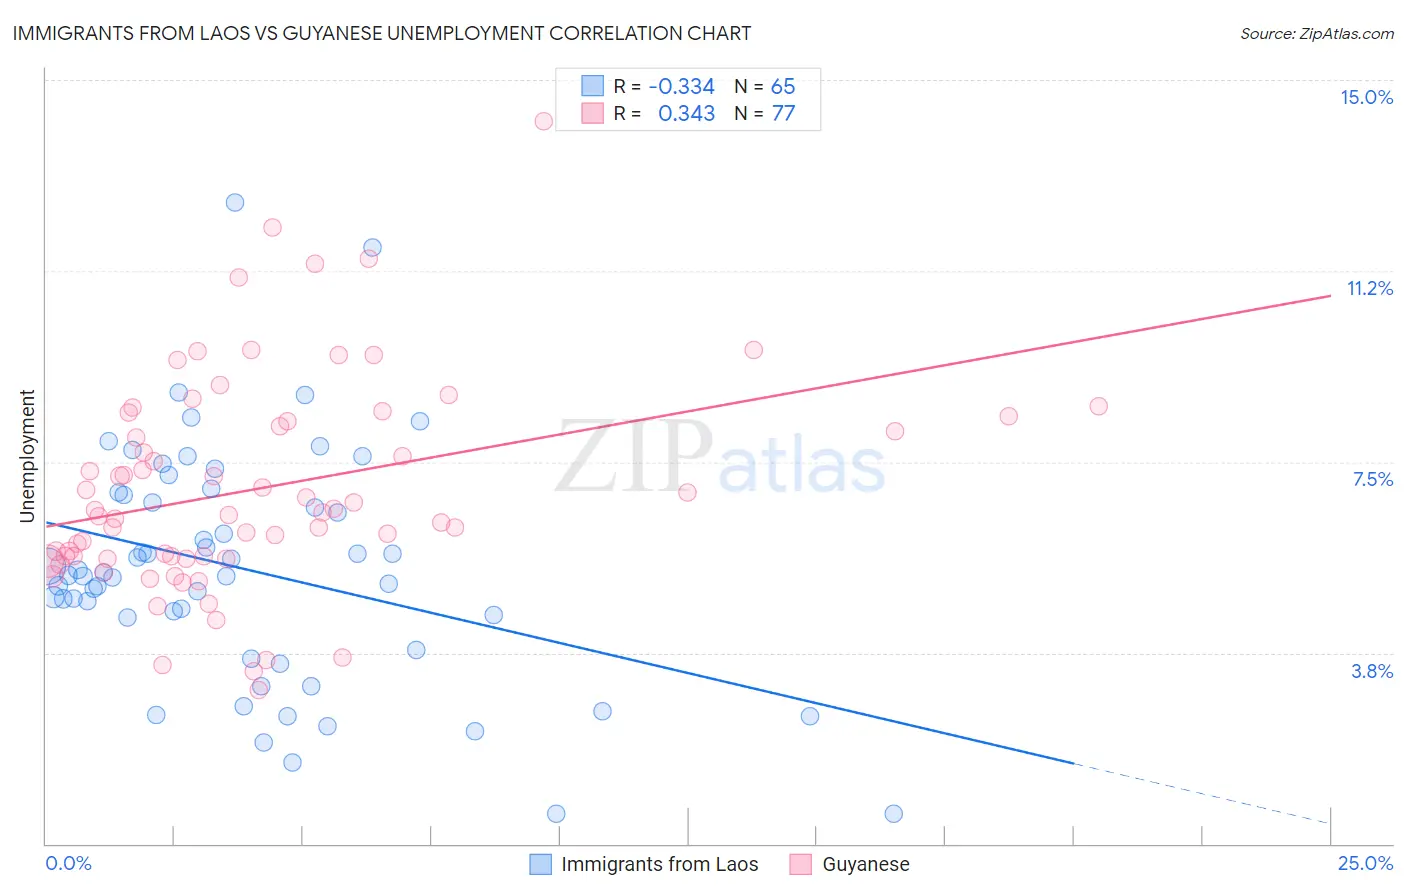
Immigrants from Laos vs Guyanese Unemployment Correlation Chart
The statistical analysis conducted on geographies consisting of 201,374,148 people shows a mild negative correlation between the proportion of Immigrants from Laos and unemployment in the United States with a correlation coefficient (R) of -0.334 and weighted average of 5.3%. Similarly, the statistical analysis conducted on geographies consisting of 176,860,990 people shows a mild positive correlation between the proportion of Guyanese and unemployment in the United States with a correlation coefficient (R) of 0.343 and weighted average of 6.9%, a difference of 29.5%.
Unemployment Correlation Summary
| Measurement | Immigrants from Laos | Guyanese |
| Minimum | 0.60% | 3.0% |
| Maximum | 12.6% | 14.2% |
| Range | 12.0% | 11.2% |
| Mean | 5.4% | 7.0% |
| Median | 5.3% | 6.5% |
| Interquartile 25% (IQ1) | 4.1% | 5.6% |
| Interquartile 75% (IQ3) | 6.9% | 8.3% |
| Interquartile Range (IQR) | 2.7% | 2.7% |
| Standard Deviation (Sample) | 2.3% | 2.1% |
| Standard Deviation (Population) | 2.3% | 2.1% |
Similar Demographics by Unemployment
Demographics Similar to Immigrants from Laos by Unemployment
In terms of unemployment, the demographic groups most similar to Immigrants from Laos are Immigrants from Southern Europe (5.3%, a difference of 0.0%), Peruvian (5.3%, a difference of 0.080%), Immigrants from Uruguay (5.3%, a difference of 0.080%), Immigrants from Israel (5.3%, a difference of 0.17%), and Immigrants from Afghanistan (5.3%, a difference of 0.17%).
| Demographics | Rating | Rank | Unemployment |
| Costa Ricans | 37.4 /100 | #187 | Fair 5.3% |
| Alsatians | 37.0 /100 | #188 | Fair 5.3% |
| Immigrants | Belarus | 35.6 /100 | #189 | Fair 5.3% |
| Arabs | 35.3 /100 | #190 | Fair 5.3% |
| Somalis | 34.0 /100 | #191 | Fair 5.3% |
| South Americans | 33.9 /100 | #192 | Fair 5.3% |
| Immigrants | Somalia | 33.8 /100 | #193 | Fair 5.3% |
| Immigrants | Laos | 30.9 /100 | #194 | Fair 5.3% |
| Immigrants | Southern Europe | 30.9 /100 | #195 | Fair 5.3% |
| Peruvians | 29.9 /100 | #196 | Fair 5.3% |
| Immigrants | Uruguay | 29.8 /100 | #197 | Fair 5.3% |
| Immigrants | Israel | 28.6 /100 | #198 | Fair 5.3% |
| Immigrants | Afghanistan | 28.6 /100 | #199 | Fair 5.3% |
| Koreans | 27.4 /100 | #200 | Fair 5.3% |
| Immigrants | South Eastern Asia | 27.0 /100 | #201 | Fair 5.3% |
Demographics Similar to Guyanese by Unemployment
In terms of unemployment, the demographic groups most similar to Guyanese are Immigrants from Guyana (6.9%, a difference of 0.040%), Immigrants from St. Vincent and the Grenadines (6.9%, a difference of 0.050%), Immigrants from Grenada (6.9%, a difference of 0.32%), British West Indian (6.8%, a difference of 0.85%), and Immigrants from Cabo Verde (6.8%, a difference of 1.1%).
| Demographics | Rating | Rank | Unemployment |
| Houma | 0.0 /100 | #315 | Tragic 6.7% |
| Immigrants | Dominica | 0.0 /100 | #316 | Tragic 6.7% |
| Shoshone | 0.0 /100 | #317 | Tragic 6.8% |
| Immigrants | Cabo Verde | 0.0 /100 | #318 | Tragic 6.8% |
| British West Indians | 0.0 /100 | #319 | Tragic 6.8% |
| Immigrants | St. Vincent and the Grenadines | 0.0 /100 | #320 | Tragic 6.9% |
| Immigrants | Guyana | 0.0 /100 | #321 | Tragic 6.9% |
| Guyanese | 0.0 /100 | #322 | Tragic 6.9% |
| Immigrants | Grenada | 0.0 /100 | #323 | Tragic 6.9% |
| Immigrants | Armenia | 0.0 /100 | #324 | Tragic 7.0% |
| Natives/Alaskans | 0.0 /100 | #325 | Tragic 7.0% |
| Paiute | 0.0 /100 | #326 | Tragic 7.1% |
| Pueblo | 0.0 /100 | #327 | Tragic 7.2% |
| Tsimshian | 0.0 /100 | #328 | Tragic 7.2% |
| Alaska Natives | 0.0 /100 | #329 | Tragic 7.2% |