Immigrants from Laos vs Immigrants from Senegal Unemployment
COMPARE
Immigrants from Laos
Immigrants from Senegal
Unemployment
Unemployment Comparison
Immigrants from Laos
Immigrants from Senegal
5.3%
UNEMPLOYMENT
30.9/ 100
METRIC RATING
194th/ 347
METRIC RANK
6.1%
UNEMPLOYMENT
0.0/ 100
METRIC RATING
285th/ 347
METRIC RANK
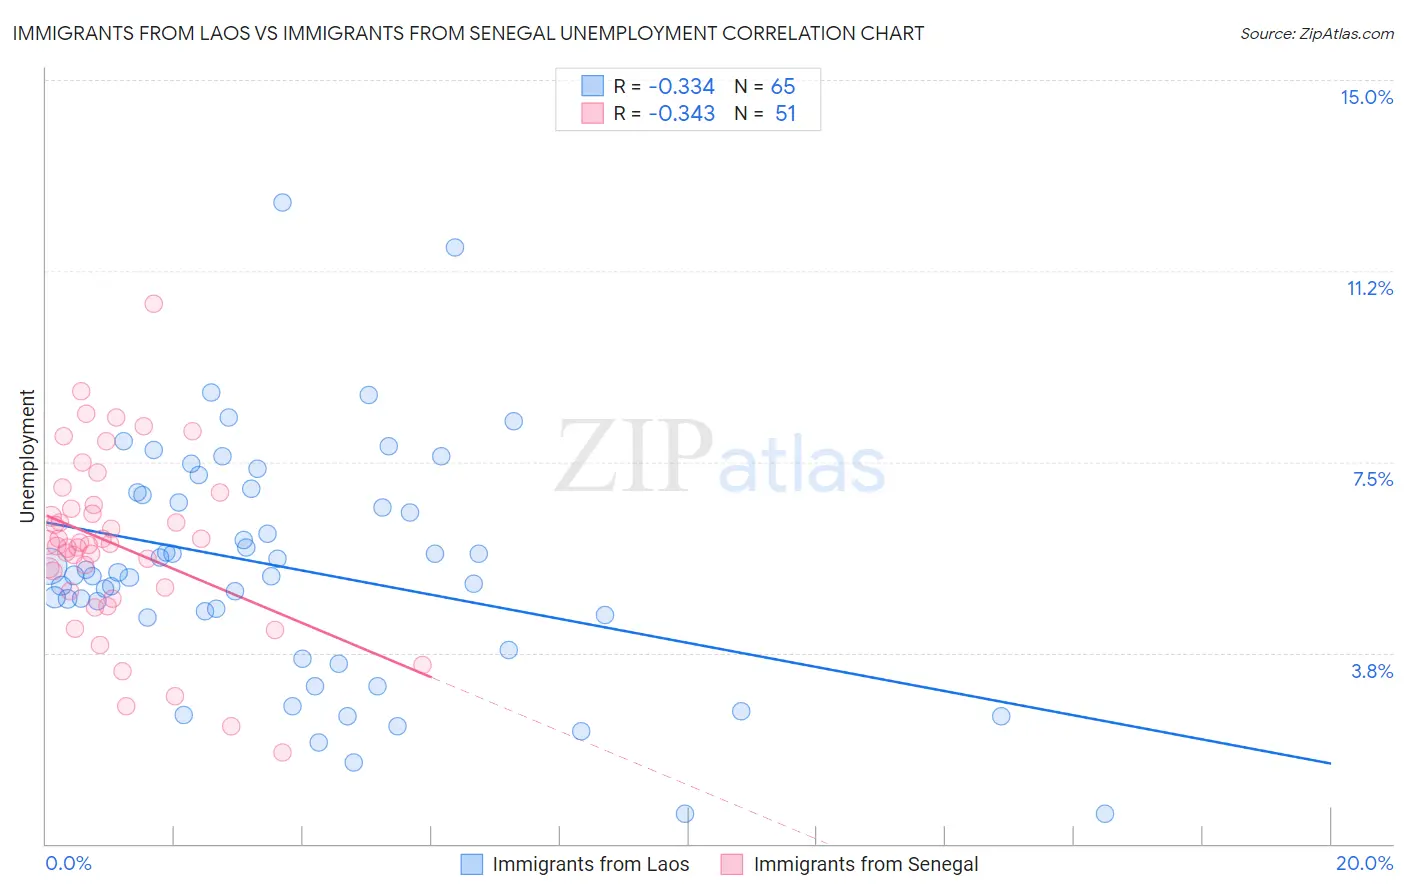
Immigrants from Laos vs Immigrants from Senegal Unemployment Correlation Chart
The statistical analysis conducted on geographies consisting of 201,374,148 people shows a mild negative correlation between the proportion of Immigrants from Laos and unemployment in the United States with a correlation coefficient (R) of -0.334 and weighted average of 5.3%. Similarly, the statistical analysis conducted on geographies consisting of 90,076,703 people shows a mild negative correlation between the proportion of Immigrants from Senegal and unemployment in the United States with a correlation coefficient (R) of -0.343 and weighted average of 6.1%, a difference of 15.1%.
Unemployment Correlation Summary
| Measurement | Immigrants from Laos | Immigrants from Senegal |
| Minimum | 0.60% | 1.8% |
| Maximum | 12.6% | 10.6% |
| Range | 12.0% | 8.8% |
| Mean | 5.4% | 5.9% |
| Median | 5.3% | 5.9% |
| Interquartile 25% (IQ1) | 4.1% | 5.0% |
| Interquartile 75% (IQ3) | 6.9% | 6.6% |
| Interquartile Range (IQR) | 2.7% | 1.7% |
| Standard Deviation (Sample) | 2.3% | 1.7% |
| Standard Deviation (Population) | 2.3% | 1.7% |
Similar Demographics by Unemployment
Demographics Similar to Immigrants from Laos by Unemployment
In terms of unemployment, the demographic groups most similar to Immigrants from Laos are Immigrants from Southern Europe (5.3%, a difference of 0.0%), Peruvian (5.3%, a difference of 0.080%), Immigrants from Uruguay (5.3%, a difference of 0.080%), Immigrants from Israel (5.3%, a difference of 0.17%), and Immigrants from Afghanistan (5.3%, a difference of 0.17%).
| Demographics | Rating | Rank | Unemployment |
| Costa Ricans | 37.4 /100 | #187 | Fair 5.3% |
| Alsatians | 37.0 /100 | #188 | Fair 5.3% |
| Immigrants | Belarus | 35.6 /100 | #189 | Fair 5.3% |
| Arabs | 35.3 /100 | #190 | Fair 5.3% |
| Somalis | 34.0 /100 | #191 | Fair 5.3% |
| South Americans | 33.9 /100 | #192 | Fair 5.3% |
| Immigrants | Somalia | 33.8 /100 | #193 | Fair 5.3% |
| Immigrants | Laos | 30.9 /100 | #194 | Fair 5.3% |
| Immigrants | Southern Europe | 30.9 /100 | #195 | Fair 5.3% |
| Peruvians | 29.9 /100 | #196 | Fair 5.3% |
| Immigrants | Uruguay | 29.8 /100 | #197 | Fair 5.3% |
| Immigrants | Israel | 28.6 /100 | #198 | Fair 5.3% |
| Immigrants | Afghanistan | 28.6 /100 | #199 | Fair 5.3% |
| Koreans | 27.4 /100 | #200 | Fair 5.3% |
| Immigrants | South Eastern Asia | 27.0 /100 | #201 | Fair 5.3% |
Demographics Similar to Immigrants from Senegal by Unemployment
In terms of unemployment, the demographic groups most similar to Immigrants from Senegal are Immigrants from Caribbean (6.2%, a difference of 0.43%), Nepalese (6.2%, a difference of 0.76%), Ecuadorian (6.2%, a difference of 0.79%), Aleut (6.1%, a difference of 0.93%), and Immigrants from Ghana (6.1%, a difference of 1.1%).
| Demographics | Rating | Rank | Unemployment |
| Ghanaians | 0.0 /100 | #278 | Tragic 6.0% |
| Immigrants | Mexico | 0.0 /100 | #279 | Tragic 6.0% |
| Immigrants | Western Africa | 0.0 /100 | #280 | Tragic 6.0% |
| Africans | 0.0 /100 | #281 | Tragic 6.1% |
| Immigrants | Azores | 0.0 /100 | #282 | Tragic 6.1% |
| Immigrants | Ghana | 0.0 /100 | #283 | Tragic 6.1% |
| Aleuts | 0.0 /100 | #284 | Tragic 6.1% |
| Immigrants | Senegal | 0.0 /100 | #285 | Tragic 6.1% |
| Immigrants | Caribbean | 0.0 /100 | #286 | Tragic 6.2% |
| Nepalese | 0.0 /100 | #287 | Tragic 6.2% |
| Ecuadorians | 0.0 /100 | #288 | Tragic 6.2% |
| Chippewa | 0.0 /100 | #289 | Tragic 6.2% |
| Senegalese | 0.0 /100 | #290 | Tragic 6.2% |
| Haitians | 0.0 /100 | #291 | Tragic 6.2% |
| Central American Indians | 0.0 /100 | #292 | Tragic 6.2% |