Jordanian vs Ute Unemployment
COMPARE
Jordanian
Ute
Unemployment
Unemployment Comparison
Jordanians
Ute
5.0%
UNEMPLOYMENT
96.4/ 100
METRIC RATING
89th/ 347
METRIC RANK
6.3%
UNEMPLOYMENT
0.0/ 100
METRIC RATING
296th/ 347
METRIC RANK
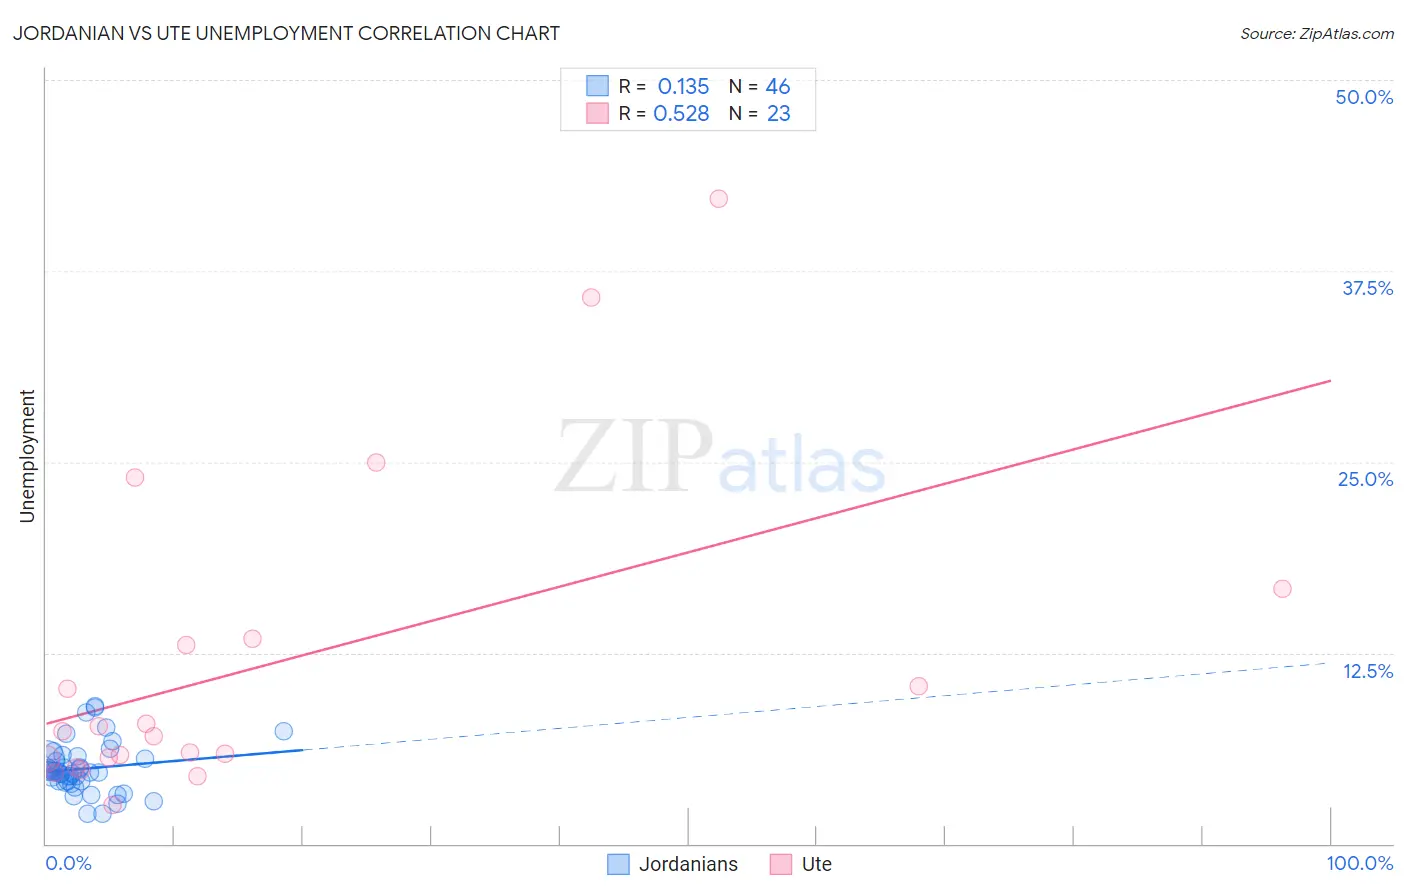
Jordanian vs Ute Unemployment Correlation Chart
The statistical analysis conducted on geographies consisting of 166,387,098 people shows a poor positive correlation between the proportion of Jordanians and unemployment in the United States with a correlation coefficient (R) of 0.135 and weighted average of 5.0%. Similarly, the statistical analysis conducted on geographies consisting of 55,641,971 people shows a substantial positive correlation between the proportion of Ute and unemployment in the United States with a correlation coefficient (R) of 0.528 and weighted average of 6.3%, a difference of 25.8%.
Unemployment Correlation Summary
| Measurement | Jordanian | Ute |
| Minimum | 2.0% | 2.5% |
| Maximum | 9.0% | 42.2% |
| Range | 7.0% | 39.7% |
| Mean | 4.9% | 11.8% |
| Median | 4.7% | 7.3% |
| Interquartile 25% (IQ1) | 4.1% | 5.5% |
| Interquartile 75% (IQ3) | 5.6% | 13.4% |
| Interquartile Range (IQR) | 1.5% | 7.9% |
| Standard Deviation (Sample) | 1.6% | 10.4% |
| Standard Deviation (Population) | 1.6% | 10.2% |
Similar Demographics by Unemployment
Demographics Similar to Jordanians by Unemployment
In terms of unemployment, the demographic groups most similar to Jordanians are Immigrants from North Macedonia (5.0%, a difference of 0.040%), Immigrants from Sudan (5.0%, a difference of 0.050%), Immigrants from South Africa (5.0%, a difference of 0.070%), Immigrants from Korea (5.0%, a difference of 0.090%), and Immigrants from Moldova (5.0%, a difference of 0.12%).
| Demographics | Rating | Rank | Unemployment |
| Fijians | 97.6 /100 | #82 | Exceptional 5.0% |
| Hmong | 97.6 /100 | #83 | Exceptional 5.0% |
| Russians | 97.4 /100 | #84 | Exceptional 5.0% |
| Immigrants | Australia | 97.0 /100 | #85 | Exceptional 5.0% |
| Hungarians | 96.9 /100 | #86 | Exceptional 5.0% |
| Immigrants | Moldova | 96.6 /100 | #87 | Exceptional 5.0% |
| Immigrants | Korea | 96.6 /100 | #88 | Exceptional 5.0% |
| Jordanians | 96.4 /100 | #89 | Exceptional 5.0% |
| Immigrants | North Macedonia | 96.3 /100 | #90 | Exceptional 5.0% |
| Immigrants | Sudan | 96.3 /100 | #91 | Exceptional 5.0% |
| Immigrants | South Africa | 96.2 /100 | #92 | Exceptional 5.0% |
| Ukrainians | 96.0 /100 | #93 | Exceptional 5.0% |
| Immigrants | Austria | 95.9 /100 | #94 | Exceptional 5.0% |
| Immigrants | Serbia | 95.6 /100 | #95 | Exceptional 5.0% |
| Immigrants | England | 95.2 /100 | #96 | Exceptional 5.0% |
Demographics Similar to Ute by Unemployment
In terms of unemployment, the demographic groups most similar to Ute are Jamaican (6.3%, a difference of 0.34%), Immigrants from Haiti (6.3%, a difference of 0.43%), U.S. Virgin Islander (6.3%, a difference of 0.45%), Immigrants from West Indies (6.3%, a difference of 0.48%), and Immigrants from Ecuador (6.2%, a difference of 0.57%).
| Demographics | Rating | Rank | Unemployment |
| Chippewa | 0.0 /100 | #289 | Tragic 6.2% |
| Senegalese | 0.0 /100 | #290 | Tragic 6.2% |
| Haitians | 0.0 /100 | #291 | Tragic 6.2% |
| Central American Indians | 0.0 /100 | #292 | Tragic 6.2% |
| Immigrants | Ecuador | 0.0 /100 | #293 | Tragic 6.2% |
| Spanish American Indians | 0.0 /100 | #294 | Tragic 6.2% |
| U.S. Virgin Islanders | 0.0 /100 | #295 | Tragic 6.3% |
| Ute | 0.0 /100 | #296 | Tragic 6.3% |
| Jamaicans | 0.0 /100 | #297 | Tragic 6.3% |
| Immigrants | Haiti | 0.0 /100 | #298 | Tragic 6.3% |
| Immigrants | West Indies | 0.0 /100 | #299 | Tragic 6.3% |
| Immigrants | Trinidad and Tobago | 0.0 /100 | #300 | Tragic 6.3% |
| Trinidadians and Tobagonians | 0.0 /100 | #301 | Tragic 6.3% |
| West Indians | 0.0 /100 | #302 | Tragic 6.4% |
| Belizeans | 0.0 /100 | #303 | Tragic 6.4% |