Liberian vs Ute Unemployment
COMPARE
Liberian
Ute
Unemployment
Unemployment Comparison
Liberians
Ute
5.6%
UNEMPLOYMENT
0.9/ 100
METRIC RATING
248th/ 347
METRIC RANK
6.3%
UNEMPLOYMENT
0.0/ 100
METRIC RATING
296th/ 347
METRIC RANK
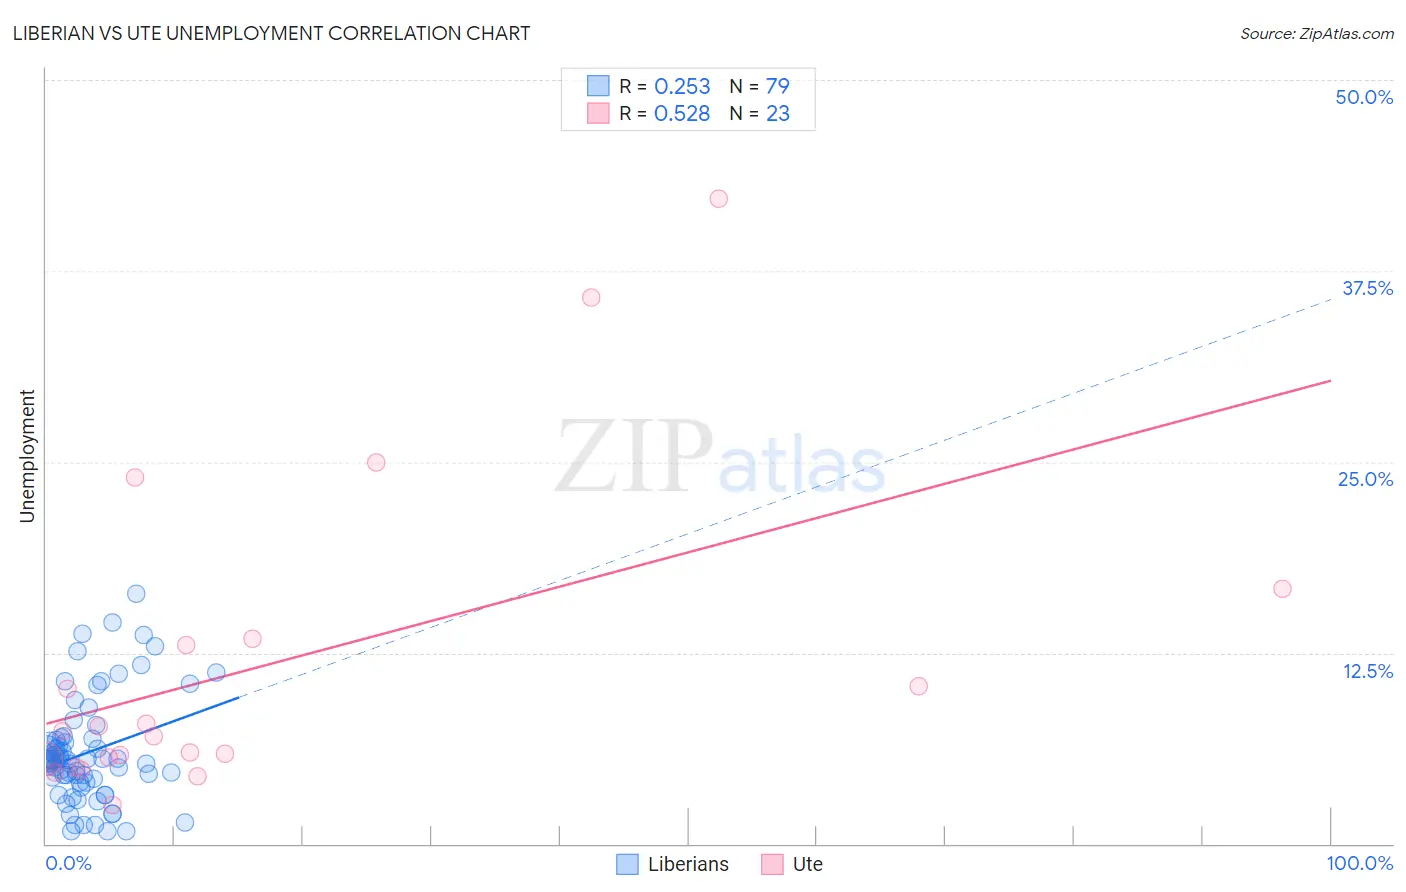
Liberian vs Ute Unemployment Correlation Chart
The statistical analysis conducted on geographies consisting of 118,076,237 people shows a weak positive correlation between the proportion of Liberians and unemployment in the United States with a correlation coefficient (R) of 0.253 and weighted average of 5.6%. Similarly, the statistical analysis conducted on geographies consisting of 55,641,971 people shows a substantial positive correlation between the proportion of Ute and unemployment in the United States with a correlation coefficient (R) of 0.528 and weighted average of 6.3%, a difference of 11.5%.
Unemployment Correlation Summary
| Measurement | Liberian | Ute |
| Minimum | 0.80% | 2.5% |
| Maximum | 16.4% | 42.2% |
| Range | 15.6% | 39.7% |
| Mean | 6.0% | 11.8% |
| Median | 5.5% | 7.3% |
| Interquartile 25% (IQ1) | 4.0% | 5.5% |
| Interquartile 75% (IQ3) | 6.9% | 13.4% |
| Interquartile Range (IQR) | 2.9% | 7.9% |
| Standard Deviation (Sample) | 3.4% | 10.4% |
| Standard Deviation (Population) | 3.4% | 10.2% |
Similar Demographics by Unemployment
Demographics Similar to Liberians by Unemployment
In terms of unemployment, the demographic groups most similar to Liberians are Immigrants from Cameroon (5.6%, a difference of 0.13%), Cajun (5.6%, a difference of 0.26%), Japanese (5.6%, a difference of 0.27%), Bermudan (5.6%, a difference of 0.28%), and French American Indian (5.6%, a difference of 0.32%).
| Demographics | Rating | Rank | Unemployment |
| Tlingit-Haida | 2.0 /100 | #241 | Tragic 5.6% |
| Spanish Americans | 2.0 /100 | #242 | Tragic 5.6% |
| Marshallese | 1.3 /100 | #243 | Tragic 5.6% |
| Dutch West Indians | 1.2 /100 | #244 | Tragic 5.6% |
| French American Indians | 1.2 /100 | #245 | Tragic 5.6% |
| Bermudans | 1.1 /100 | #246 | Tragic 5.6% |
| Immigrants | Cameroon | 1.0 /100 | #247 | Tragic 5.6% |
| Liberians | 0.9 /100 | #248 | Tragic 5.6% |
| Cajuns | 0.8 /100 | #249 | Tragic 5.6% |
| Japanese | 0.8 /100 | #250 | Tragic 5.6% |
| Kiowa | 0.6 /100 | #251 | Tragic 5.7% |
| Hondurans | 0.3 /100 | #252 | Tragic 5.7% |
| Central Americans | 0.3 /100 | #253 | Tragic 5.7% |
| Immigrants | Honduras | 0.3 /100 | #254 | Tragic 5.7% |
| Immigrants | Portugal | 0.2 /100 | #255 | Tragic 5.7% |
Demographics Similar to Ute by Unemployment
In terms of unemployment, the demographic groups most similar to Ute are Jamaican (6.3%, a difference of 0.34%), Immigrants from Haiti (6.3%, a difference of 0.43%), U.S. Virgin Islander (6.3%, a difference of 0.45%), Immigrants from West Indies (6.3%, a difference of 0.48%), and Immigrants from Ecuador (6.2%, a difference of 0.57%).
| Demographics | Rating | Rank | Unemployment |
| Chippewa | 0.0 /100 | #289 | Tragic 6.2% |
| Senegalese | 0.0 /100 | #290 | Tragic 6.2% |
| Haitians | 0.0 /100 | #291 | Tragic 6.2% |
| Central American Indians | 0.0 /100 | #292 | Tragic 6.2% |
| Immigrants | Ecuador | 0.0 /100 | #293 | Tragic 6.2% |
| Spanish American Indians | 0.0 /100 | #294 | Tragic 6.2% |
| U.S. Virgin Islanders | 0.0 /100 | #295 | Tragic 6.3% |
| Ute | 0.0 /100 | #296 | Tragic 6.3% |
| Jamaicans | 0.0 /100 | #297 | Tragic 6.3% |
| Immigrants | Haiti | 0.0 /100 | #298 | Tragic 6.3% |
| Immigrants | West Indies | 0.0 /100 | #299 | Tragic 6.3% |
| Immigrants | Trinidad and Tobago | 0.0 /100 | #300 | Tragic 6.3% |
| Trinidadians and Tobagonians | 0.0 /100 | #301 | Tragic 6.3% |
| West Indians | 0.0 /100 | #302 | Tragic 6.4% |
| Belizeans | 0.0 /100 | #303 | Tragic 6.4% |