Immigrants from Laos vs Immigrants from Belgium Unemployment
COMPARE
Immigrants from Laos
Immigrants from Belgium
Unemployment
Unemployment Comparison
Immigrants from Laos
Immigrants from Belgium
5.3%
UNEMPLOYMENT
30.9/ 100
METRIC RATING
194th/ 347
METRIC RANK
4.9%
UNEMPLOYMENT
99.2/ 100
METRIC RATING
51st/ 347
METRIC RANK
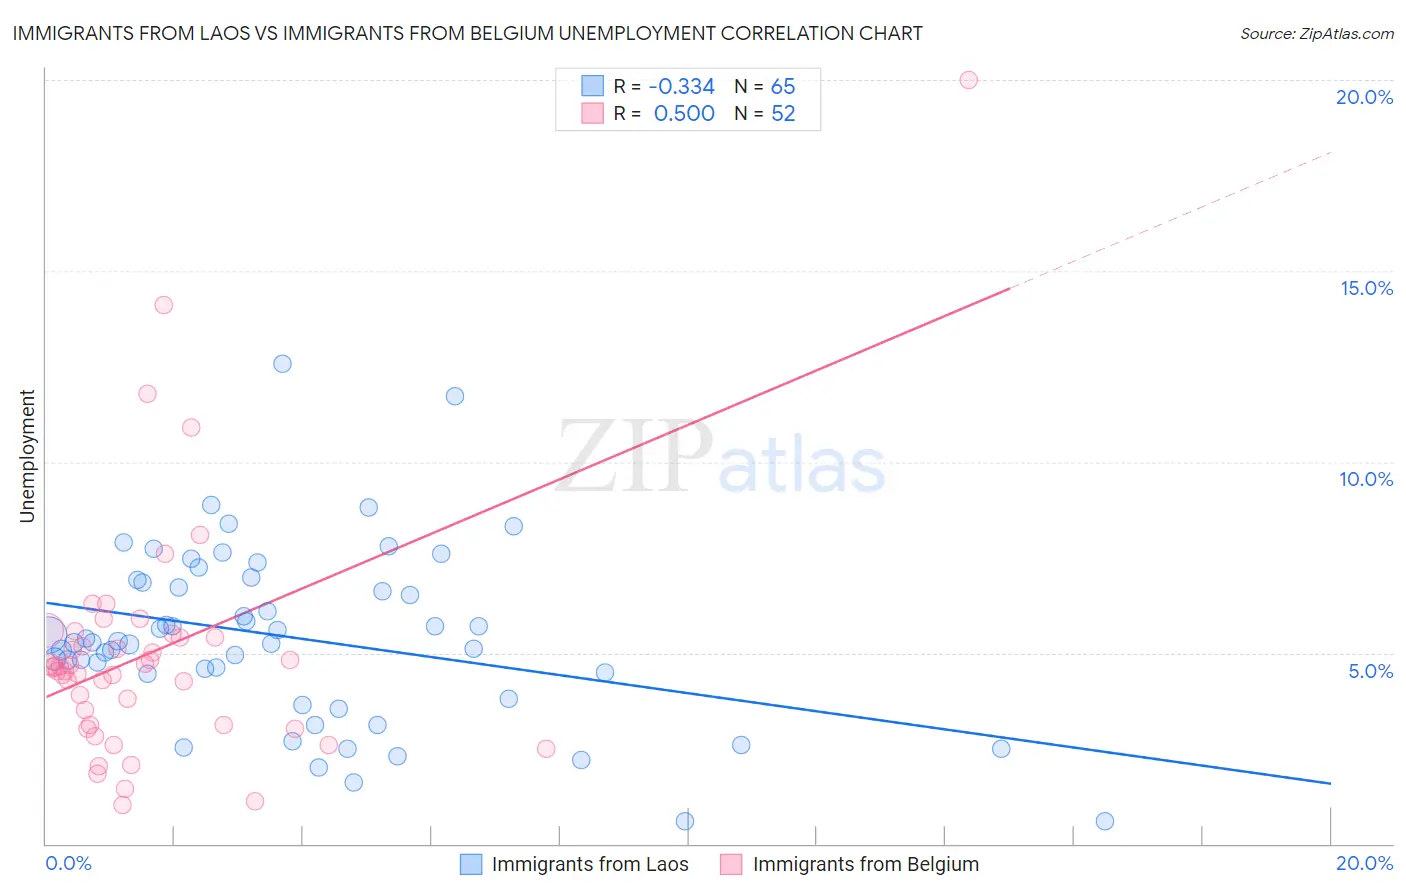
Immigrants from Laos vs Immigrants from Belgium Unemployment Correlation Chart
The statistical analysis conducted on geographies consisting of 201,374,148 people shows a mild negative correlation between the proportion of Immigrants from Laos and unemployment in the United States with a correlation coefficient (R) of -0.334 and weighted average of 5.3%. Similarly, the statistical analysis conducted on geographies consisting of 146,688,152 people shows a substantial positive correlation between the proportion of Immigrants from Belgium and unemployment in the United States with a correlation coefficient (R) of 0.500 and weighted average of 4.9%, a difference of 9.4%.
Unemployment Correlation Summary
| Measurement | Immigrants from Laos | Immigrants from Belgium |
| Minimum | 0.60% | 1.0% |
| Maximum | 12.6% | 20.0% |
| Range | 12.0% | 19.0% |
| Mean | 5.4% | 5.0% |
| Median | 5.3% | 4.6% |
| Interquartile 25% (IQ1) | 4.1% | 3.1% |
| Interquartile 75% (IQ3) | 6.9% | 5.4% |
| Interquartile Range (IQR) | 2.7% | 2.3% |
| Standard Deviation (Sample) | 2.3% | 3.2% |
| Standard Deviation (Population) | 2.3% | 3.2% |
Similar Demographics by Unemployment
Demographics Similar to Immigrants from Laos by Unemployment
In terms of unemployment, the demographic groups most similar to Immigrants from Laos are Immigrants from Southern Europe (5.3%, a difference of 0.0%), Peruvian (5.3%, a difference of 0.080%), Immigrants from Uruguay (5.3%, a difference of 0.080%), Immigrants from Israel (5.3%, a difference of 0.17%), and Immigrants from Afghanistan (5.3%, a difference of 0.17%).
| Demographics | Rating | Rank | Unemployment |
| Costa Ricans | 37.4 /100 | #187 | Fair 5.3% |
| Alsatians | 37.0 /100 | #188 | Fair 5.3% |
| Immigrants | Belarus | 35.6 /100 | #189 | Fair 5.3% |
| Arabs | 35.3 /100 | #190 | Fair 5.3% |
| Somalis | 34.0 /100 | #191 | Fair 5.3% |
| South Americans | 33.9 /100 | #192 | Fair 5.3% |
| Immigrants | Somalia | 33.8 /100 | #193 | Fair 5.3% |
| Immigrants | Laos | 30.9 /100 | #194 | Fair 5.3% |
| Immigrants | Southern Europe | 30.9 /100 | #195 | Fair 5.3% |
| Peruvians | 29.9 /100 | #196 | Fair 5.3% |
| Immigrants | Uruguay | 29.8 /100 | #197 | Fair 5.3% |
| Immigrants | Israel | 28.6 /100 | #198 | Fair 5.3% |
| Immigrants | Afghanistan | 28.6 /100 | #199 | Fair 5.3% |
| Koreans | 27.4 /100 | #200 | Fair 5.3% |
| Immigrants | South Eastern Asia | 27.0 /100 | #201 | Fair 5.3% |
Demographics Similar to Immigrants from Belgium by Unemployment
In terms of unemployment, the demographic groups most similar to Immigrants from Belgium are White/Caucasian (4.9%, a difference of 0.010%), Immigrants from Zimbabwe (4.9%, a difference of 0.040%), Eastern European (4.9%, a difference of 0.070%), Australian (4.9%, a difference of 0.10%), and French Canadian (4.9%, a difference of 0.16%).
| Demographics | Rating | Rank | Unemployment |
| Austrians | 99.5 /100 | #44 | Exceptional 4.8% |
| French | 99.5 /100 | #45 | Exceptional 4.8% |
| Immigrants | Nepal | 99.4 /100 | #46 | Exceptional 4.8% |
| Immigrants | Taiwan | 99.4 /100 | #47 | Exceptional 4.8% |
| Immigrants | Scotland | 99.3 /100 | #48 | Exceptional 4.9% |
| Immigrants | South Central Asia | 99.3 /100 | #49 | Exceptional 4.9% |
| French Canadians | 99.3 /100 | #50 | Exceptional 4.9% |
| Immigrants | Belgium | 99.2 /100 | #51 | Exceptional 4.9% |
| Whites/Caucasians | 99.2 /100 | #52 | Exceptional 4.9% |
| Immigrants | Zimbabwe | 99.2 /100 | #53 | Exceptional 4.9% |
| Eastern Europeans | 99.2 /100 | #54 | Exceptional 4.9% |
| Australians | 99.2 /100 | #55 | Exceptional 4.9% |
| Celtics | 99.1 /100 | #56 | Exceptional 4.9% |
| Immigrants | Singapore | 99.1 /100 | #57 | Exceptional 4.9% |
| Greeks | 99.0 /100 | #58 | Exceptional 4.9% |