Immigrants from North America vs Immigrants from Senegal Unemployment
COMPARE
Immigrants from North America
Immigrants from Senegal
Unemployment
Unemployment Comparison
Immigrants from North America
Immigrants from Senegal
4.9%
UNEMPLOYMENT
98.5/ 100
METRIC RATING
69th/ 347
METRIC RANK
6.1%
UNEMPLOYMENT
0.0/ 100
METRIC RATING
285th/ 347
METRIC RANK
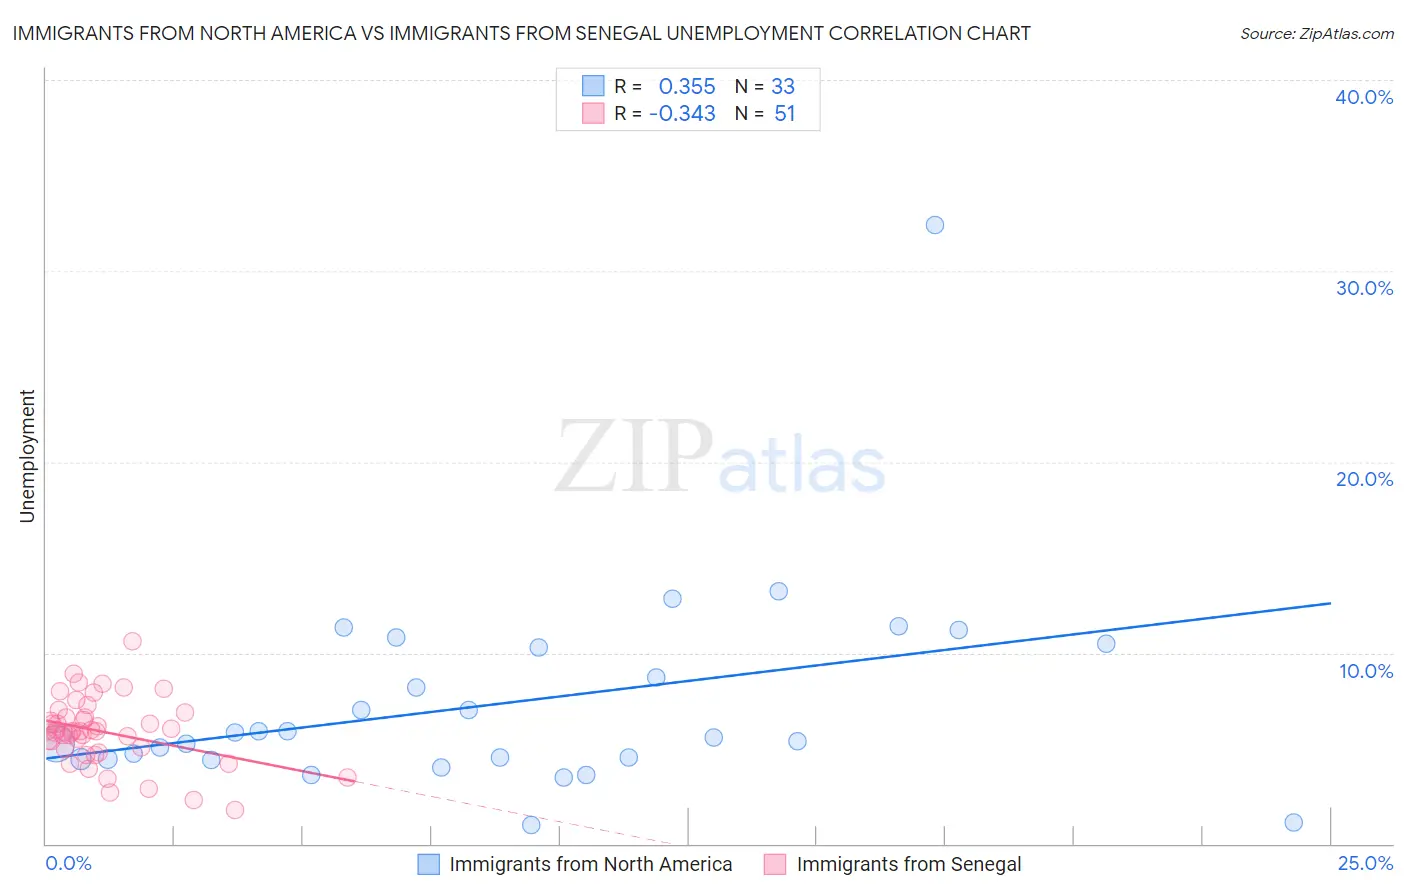
Immigrants from North America vs Immigrants from Senegal Unemployment Correlation Chart
The statistical analysis conducted on geographies consisting of 461,564,584 people shows a mild positive correlation between the proportion of Immigrants from North America and unemployment in the United States with a correlation coefficient (R) of 0.355 and weighted average of 4.9%. Similarly, the statistical analysis conducted on geographies consisting of 90,076,703 people shows a mild negative correlation between the proportion of Immigrants from Senegal and unemployment in the United States with a correlation coefficient (R) of -0.343 and weighted average of 6.1%, a difference of 24.6%.
Unemployment Correlation Summary
| Measurement | Immigrants from North America | Immigrants from Senegal |
| Minimum | 1.0% | 1.8% |
| Maximum | 32.4% | 10.6% |
| Range | 31.4% | 8.8% |
| Mean | 7.4% | 5.9% |
| Median | 5.6% | 5.9% |
| Interquartile 25% (IQ1) | 4.4% | 5.0% |
| Interquartile 75% (IQ3) | 10.4% | 6.6% |
| Interquartile Range (IQR) | 5.9% | 1.7% |
| Standard Deviation (Sample) | 5.5% | 1.7% |
| Standard Deviation (Population) | 5.5% | 1.7% |
Similar Demographics by Unemployment
Demographics Similar to Immigrants from North America by Unemployment
In terms of unemployment, the demographic groups most similar to Immigrants from North America are Slavic (4.9%, a difference of 0.090%), New Zealander (4.9%, a difference of 0.12%), Serbian (4.9%, a difference of 0.15%), Slovak (4.9%, a difference of 0.16%), and Immigrants from Japan (4.9%, a difference of 0.21%).
| Demographics | Rating | Rank | Unemployment |
| Icelanders | 98.9 /100 | #62 | Exceptional 4.9% |
| Immigrants | Bulgaria | 98.9 /100 | #63 | Exceptional 4.9% |
| Italians | 98.9 /100 | #64 | Exceptional 4.9% |
| Immigrants | Canada | 98.8 /100 | #65 | Exceptional 4.9% |
| Slovaks | 98.7 /100 | #66 | Exceptional 4.9% |
| New Zealanders | 98.6 /100 | #67 | Exceptional 4.9% |
| Slavs | 98.6 /100 | #68 | Exceptional 4.9% |
| Immigrants | North America | 98.5 /100 | #69 | Exceptional 4.9% |
| Serbians | 98.4 /100 | #70 | Exceptional 4.9% |
| Immigrants | Japan | 98.3 /100 | #71 | Exceptional 4.9% |
| Burmese | 98.3 /100 | #72 | Exceptional 4.9% |
| Paraguayans | 98.3 /100 | #73 | Exceptional 4.9% |
| Immigrants | Northern Europe | 98.2 /100 | #74 | Exceptional 4.9% |
| Turks | 98.0 /100 | #75 | Exceptional 4.9% |
| German Russians | 98.0 /100 | #76 | Exceptional 4.9% |
Demographics Similar to Immigrants from Senegal by Unemployment
In terms of unemployment, the demographic groups most similar to Immigrants from Senegal are Immigrants from Caribbean (6.2%, a difference of 0.43%), Nepalese (6.2%, a difference of 0.76%), Ecuadorian (6.2%, a difference of 0.79%), Aleut (6.1%, a difference of 0.93%), and Immigrants from Ghana (6.1%, a difference of 1.1%).
| Demographics | Rating | Rank | Unemployment |
| Ghanaians | 0.0 /100 | #278 | Tragic 6.0% |
| Immigrants | Mexico | 0.0 /100 | #279 | Tragic 6.0% |
| Immigrants | Western Africa | 0.0 /100 | #280 | Tragic 6.0% |
| Africans | 0.0 /100 | #281 | Tragic 6.1% |
| Immigrants | Azores | 0.0 /100 | #282 | Tragic 6.1% |
| Immigrants | Ghana | 0.0 /100 | #283 | Tragic 6.1% |
| Aleuts | 0.0 /100 | #284 | Tragic 6.1% |
| Immigrants | Senegal | 0.0 /100 | #285 | Tragic 6.1% |
| Immigrants | Caribbean | 0.0 /100 | #286 | Tragic 6.2% |
| Nepalese | 0.0 /100 | #287 | Tragic 6.2% |
| Ecuadorians | 0.0 /100 | #288 | Tragic 6.2% |
| Chippewa | 0.0 /100 | #289 | Tragic 6.2% |
| Senegalese | 0.0 /100 | #290 | Tragic 6.2% |
| Haitians | 0.0 /100 | #291 | Tragic 6.2% |
| Central American Indians | 0.0 /100 | #292 | Tragic 6.2% |