Immigrants from Ecuador vs Immigrants from Senegal Unemployment
COMPARE
Immigrants from Ecuador
Immigrants from Senegal
Unemployment
Unemployment Comparison
Immigrants from Ecuador
Immigrants from Senegal
6.2%
UNEMPLOYMENT
0.0/ 100
METRIC RATING
293rd/ 347
METRIC RANK
6.1%
UNEMPLOYMENT
0.0/ 100
METRIC RATING
285th/ 347
METRIC RANK
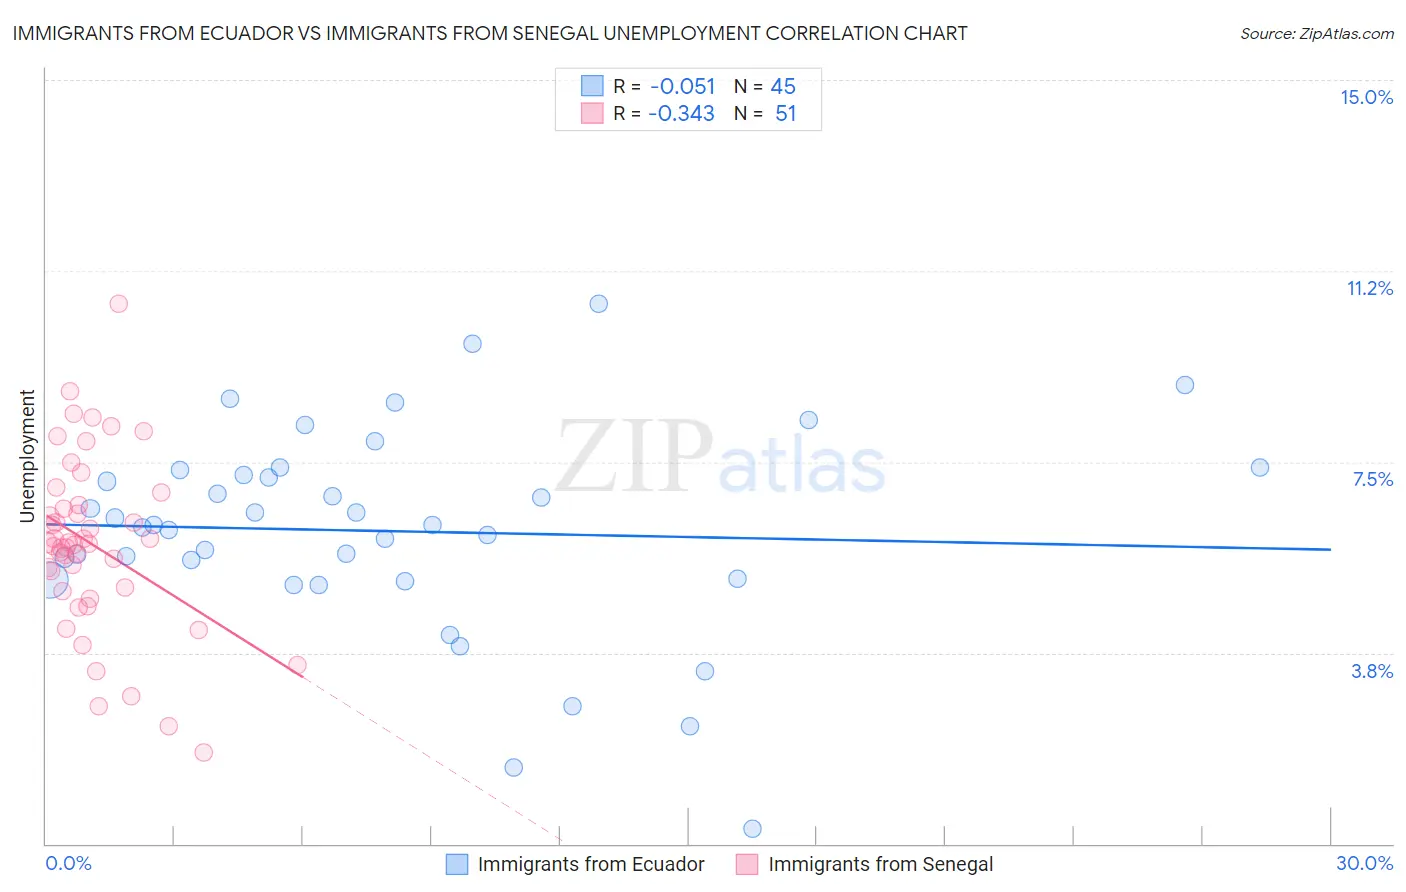
Immigrants from Ecuador vs Immigrants from Senegal Unemployment Correlation Chart
The statistical analysis conducted on geographies consisting of 270,858,036 people shows a slight negative correlation between the proportion of Immigrants from Ecuador and unemployment in the United States with a correlation coefficient (R) of -0.051 and weighted average of 6.2%. Similarly, the statistical analysis conducted on geographies consisting of 90,076,703 people shows a mild negative correlation between the proportion of Immigrants from Senegal and unemployment in the United States with a correlation coefficient (R) of -0.343 and weighted average of 6.1%, a difference of 1.9%.
Unemployment Correlation Summary
| Measurement | Immigrants from Ecuador | Immigrants from Senegal |
| Minimum | 0.30% | 1.8% |
| Maximum | 10.6% | 10.6% |
| Range | 10.3% | 8.8% |
| Mean | 6.1% | 5.9% |
| Median | 6.3% | 5.9% |
| Interquartile 25% (IQ1) | 5.2% | 5.0% |
| Interquartile 75% (IQ3) | 7.3% | 6.6% |
| Interquartile Range (IQR) | 2.1% | 1.7% |
| Standard Deviation (Sample) | 2.0% | 1.7% |
| Standard Deviation (Population) | 2.0% | 1.7% |
Demographics Similar to Immigrants from Ecuador and Immigrants from Senegal by Unemployment
In terms of unemployment, the demographic groups most similar to Immigrants from Ecuador are Spanish American Indian (6.2%, a difference of 0.0%), Central American Indian (6.2%, a difference of 0.090%), Haitian (6.2%, a difference of 0.11%), U.S. Virgin Islander (6.3%, a difference of 0.12%), and Ute (6.3%, a difference of 0.57%). Similarly, the demographic groups most similar to Immigrants from Senegal are Immigrants from Caribbean (6.2%, a difference of 0.43%), Nepalese (6.2%, a difference of 0.76%), Ecuadorian (6.2%, a difference of 0.79%), Aleut (6.1%, a difference of 0.93%), and Immigrants from Ghana (6.1%, a difference of 1.1%).
| Demographics | Rating | Rank | Unemployment |
| Immigrants | Mexico | 0.0 /100 | #279 | Tragic 6.0% |
| Immigrants | Western Africa | 0.0 /100 | #280 | Tragic 6.0% |
| Africans | 0.0 /100 | #281 | Tragic 6.1% |
| Immigrants | Azores | 0.0 /100 | #282 | Tragic 6.1% |
| Immigrants | Ghana | 0.0 /100 | #283 | Tragic 6.1% |
| Aleuts | 0.0 /100 | #284 | Tragic 6.1% |
| Immigrants | Senegal | 0.0 /100 | #285 | Tragic 6.1% |
| Immigrants | Caribbean | 0.0 /100 | #286 | Tragic 6.2% |
| Nepalese | 0.0 /100 | #287 | Tragic 6.2% |
| Ecuadorians | 0.0 /100 | #288 | Tragic 6.2% |
| Chippewa | 0.0 /100 | #289 | Tragic 6.2% |
| Senegalese | 0.0 /100 | #290 | Tragic 6.2% |
| Haitians | 0.0 /100 | #291 | Tragic 6.2% |
| Central American Indians | 0.0 /100 | #292 | Tragic 6.2% |
| Immigrants | Ecuador | 0.0 /100 | #293 | Tragic 6.2% |
| Spanish American Indians | 0.0 /100 | #294 | Tragic 6.2% |
| U.S. Virgin Islanders | 0.0 /100 | #295 | Tragic 6.3% |
| Ute | 0.0 /100 | #296 | Tragic 6.3% |
| Jamaicans | 0.0 /100 | #297 | Tragic 6.3% |
| Immigrants | Haiti | 0.0 /100 | #298 | Tragic 6.3% |
| Immigrants | West Indies | 0.0 /100 | #299 | Tragic 6.3% |