Austrian vs Immigrants from Senegal Unemployment
COMPARE
Austrian
Immigrants from Senegal
Unemployment
Unemployment Comparison
Austrians
Immigrants from Senegal
4.8%
UNEMPLOYMENT
99.5/ 100
METRIC RATING
44th/ 347
METRIC RANK
6.1%
UNEMPLOYMENT
0.0/ 100
METRIC RATING
285th/ 347
METRIC RANK
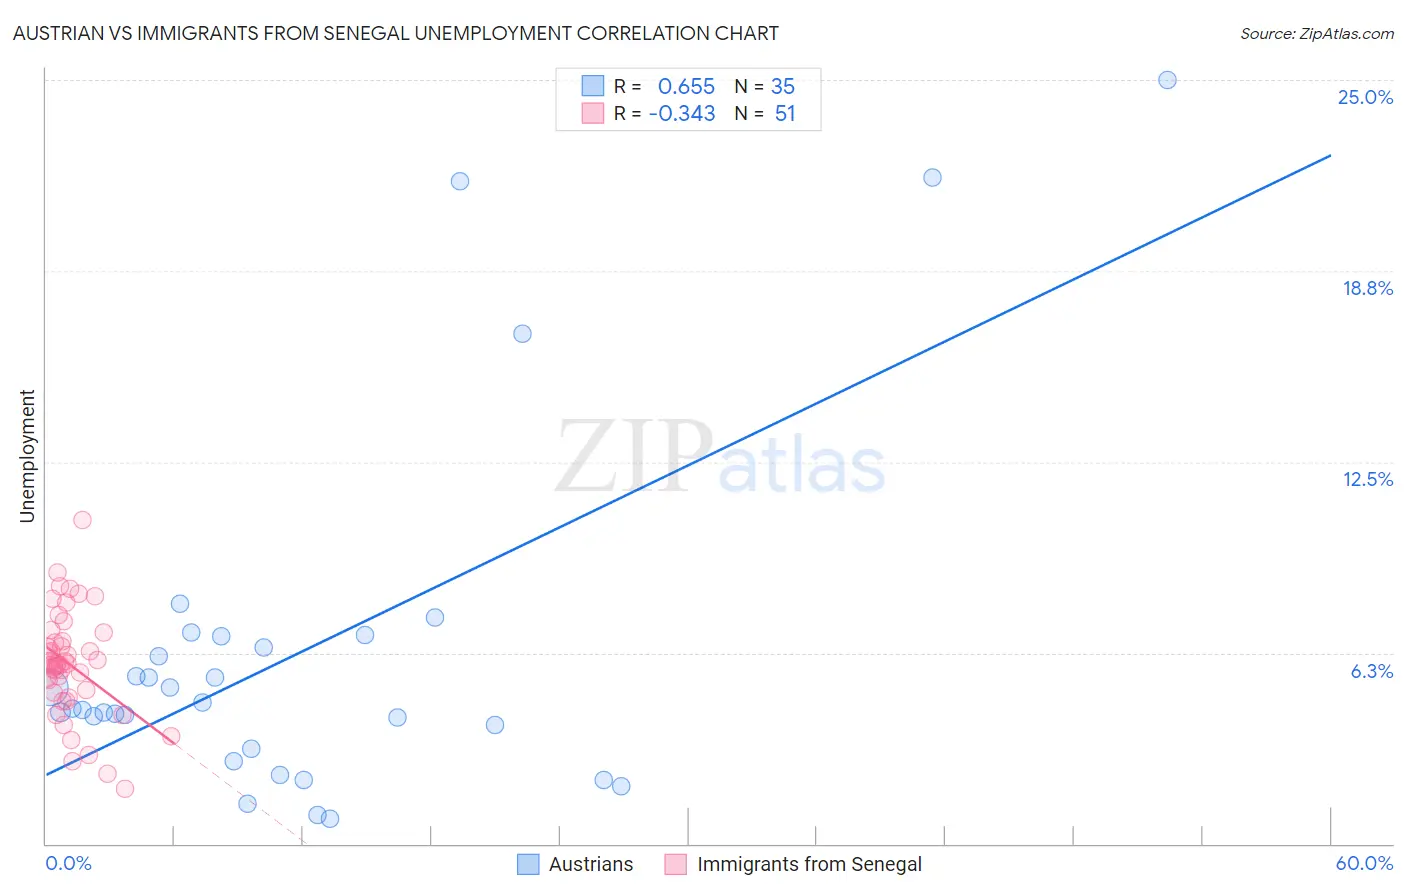
Austrian vs Immigrants from Senegal Unemployment Correlation Chart
The statistical analysis conducted on geographies consisting of 451,169,494 people shows a significant positive correlation between the proportion of Austrians and unemployment in the United States with a correlation coefficient (R) of 0.655 and weighted average of 4.8%. Similarly, the statistical analysis conducted on geographies consisting of 90,076,703 people shows a mild negative correlation between the proportion of Immigrants from Senegal and unemployment in the United States with a correlation coefficient (R) of -0.343 and weighted average of 6.1%, a difference of 26.7%.
Unemployment Correlation Summary
| Measurement | Austrian | Immigrants from Senegal |
| Minimum | 0.80% | 1.8% |
| Maximum | 25.0% | 10.6% |
| Range | 24.2% | 8.8% |
| Mean | 6.3% | 5.9% |
| Median | 4.4% | 5.9% |
| Interquartile 25% (IQ1) | 3.1% | 5.0% |
| Interquartile 75% (IQ3) | 6.8% | 6.6% |
| Interquartile Range (IQR) | 3.7% | 1.7% |
| Standard Deviation (Sample) | 5.9% | 1.7% |
| Standard Deviation (Population) | 5.8% | 1.7% |
Similar Demographics by Unemployment
Demographics Similar to Austrians by Unemployment
In terms of unemployment, the demographic groups most similar to Austrians are French (4.8%, a difference of 0.050%), Yugoslavian (4.8%, a difference of 0.060%), Immigrants from Nepal (4.8%, a difference of 0.22%), Immigrants from Taiwan (4.8%, a difference of 0.24%), and Filipino (4.8%, a difference of 0.26%).
| Demographics | Rating | Rank | Unemployment |
| Czechoslovakians | 99.7 /100 | #37 | Exceptional 4.8% |
| Bolivians | 99.7 /100 | #38 | Exceptional 4.8% |
| Lithuanians | 99.7 /100 | #39 | Exceptional 4.8% |
| Northern Europeans | 99.7 /100 | #40 | Exceptional 4.8% |
| Immigrants | Bosnia and Herzegovina | 99.7 /100 | #41 | Exceptional 4.8% |
| Filipinos | 99.5 /100 | #42 | Exceptional 4.8% |
| Yugoslavians | 99.5 /100 | #43 | Exceptional 4.8% |
| Austrians | 99.5 /100 | #44 | Exceptional 4.8% |
| French | 99.5 /100 | #45 | Exceptional 4.8% |
| Immigrants | Nepal | 99.4 /100 | #46 | Exceptional 4.8% |
| Immigrants | Taiwan | 99.4 /100 | #47 | Exceptional 4.8% |
| Immigrants | Scotland | 99.3 /100 | #48 | Exceptional 4.9% |
| Immigrants | South Central Asia | 99.3 /100 | #49 | Exceptional 4.9% |
| French Canadians | 99.3 /100 | #50 | Exceptional 4.9% |
| Immigrants | Belgium | 99.2 /100 | #51 | Exceptional 4.9% |
Demographics Similar to Immigrants from Senegal by Unemployment
In terms of unemployment, the demographic groups most similar to Immigrants from Senegal are Immigrants from Caribbean (6.2%, a difference of 0.43%), Nepalese (6.2%, a difference of 0.76%), Ecuadorian (6.2%, a difference of 0.79%), Aleut (6.1%, a difference of 0.93%), and Immigrants from Ghana (6.1%, a difference of 1.1%).
| Demographics | Rating | Rank | Unemployment |
| Ghanaians | 0.0 /100 | #278 | Tragic 6.0% |
| Immigrants | Mexico | 0.0 /100 | #279 | Tragic 6.0% |
| Immigrants | Western Africa | 0.0 /100 | #280 | Tragic 6.0% |
| Africans | 0.0 /100 | #281 | Tragic 6.1% |
| Immigrants | Azores | 0.0 /100 | #282 | Tragic 6.1% |
| Immigrants | Ghana | 0.0 /100 | #283 | Tragic 6.1% |
| Aleuts | 0.0 /100 | #284 | Tragic 6.1% |
| Immigrants | Senegal | 0.0 /100 | #285 | Tragic 6.1% |
| Immigrants | Caribbean | 0.0 /100 | #286 | Tragic 6.2% |
| Nepalese | 0.0 /100 | #287 | Tragic 6.2% |
| Ecuadorians | 0.0 /100 | #288 | Tragic 6.2% |
| Chippewa | 0.0 /100 | #289 | Tragic 6.2% |
| Senegalese | 0.0 /100 | #290 | Tragic 6.2% |
| Haitians | 0.0 /100 | #291 | Tragic 6.2% |
| Central American Indians | 0.0 /100 | #292 | Tragic 6.2% |