Immigrants from Scotland vs Immigrants from Senegal Unemployment
COMPARE
Immigrants from Scotland
Immigrants from Senegal
Unemployment
Unemployment Comparison
Immigrants from Scotland
Immigrants from Senegal
4.9%
UNEMPLOYMENT
99.3/ 100
METRIC RATING
48th/ 347
METRIC RANK
6.1%
UNEMPLOYMENT
0.0/ 100
METRIC RATING
285th/ 347
METRIC RANK
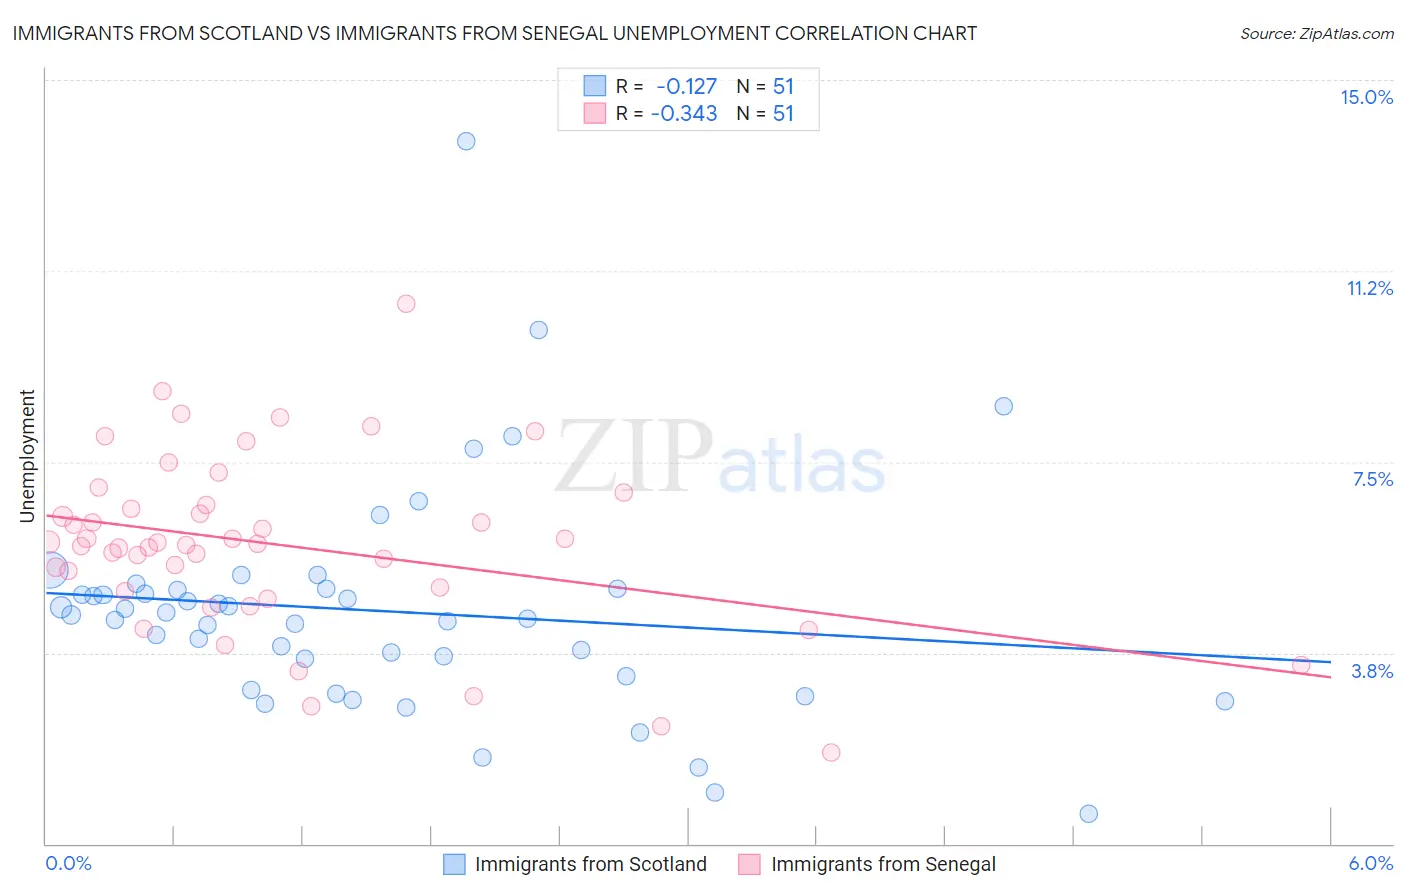
Immigrants from Scotland vs Immigrants from Senegal Unemployment Correlation Chart
The statistical analysis conducted on geographies consisting of 196,312,940 people shows a poor negative correlation between the proportion of Immigrants from Scotland and unemployment in the United States with a correlation coefficient (R) of -0.127 and weighted average of 4.9%. Similarly, the statistical analysis conducted on geographies consisting of 90,076,703 people shows a mild negative correlation between the proportion of Immigrants from Senegal and unemployment in the United States with a correlation coefficient (R) of -0.343 and weighted average of 6.1%, a difference of 26.2%.
Unemployment Correlation Summary
| Measurement | Immigrants from Scotland | Immigrants from Senegal |
| Minimum | 0.60% | 1.8% |
| Maximum | 13.8% | 10.6% |
| Range | 13.2% | 8.8% |
| Mean | 4.6% | 5.9% |
| Median | 4.5% | 5.9% |
| Interquartile 25% (IQ1) | 3.3% | 5.0% |
| Interquartile 75% (IQ3) | 5.0% | 6.6% |
| Interquartile Range (IQR) | 1.7% | 1.7% |
| Standard Deviation (Sample) | 2.2% | 1.7% |
| Standard Deviation (Population) | 2.2% | 1.7% |
Similar Demographics by Unemployment
Demographics Similar to Immigrants from Scotland by Unemployment
In terms of unemployment, the demographic groups most similar to Immigrants from Scotland are Immigrants from South Central Asia (4.9%, a difference of 0.010%), French Canadian (4.9%, a difference of 0.030%), Immigrants from Belgium (4.9%, a difference of 0.19%), White/Caucasian (4.9%, a difference of 0.20%), and Immigrants from Taiwan (4.8%, a difference of 0.22%).
| Demographics | Rating | Rank | Unemployment |
| Immigrants | Bosnia and Herzegovina | 99.7 /100 | #41 | Exceptional 4.8% |
| Filipinos | 99.5 /100 | #42 | Exceptional 4.8% |
| Yugoslavians | 99.5 /100 | #43 | Exceptional 4.8% |
| Austrians | 99.5 /100 | #44 | Exceptional 4.8% |
| French | 99.5 /100 | #45 | Exceptional 4.8% |
| Immigrants | Nepal | 99.4 /100 | #46 | Exceptional 4.8% |
| Immigrants | Taiwan | 99.4 /100 | #47 | Exceptional 4.8% |
| Immigrants | Scotland | 99.3 /100 | #48 | Exceptional 4.9% |
| Immigrants | South Central Asia | 99.3 /100 | #49 | Exceptional 4.9% |
| French Canadians | 99.3 /100 | #50 | Exceptional 4.9% |
| Immigrants | Belgium | 99.2 /100 | #51 | Exceptional 4.9% |
| Whites/Caucasians | 99.2 /100 | #52 | Exceptional 4.9% |
| Immigrants | Zimbabwe | 99.2 /100 | #53 | Exceptional 4.9% |
| Eastern Europeans | 99.2 /100 | #54 | Exceptional 4.9% |
| Australians | 99.2 /100 | #55 | Exceptional 4.9% |
Demographics Similar to Immigrants from Senegal by Unemployment
In terms of unemployment, the demographic groups most similar to Immigrants from Senegal are Immigrants from Caribbean (6.2%, a difference of 0.43%), Nepalese (6.2%, a difference of 0.76%), Ecuadorian (6.2%, a difference of 0.79%), Aleut (6.1%, a difference of 0.93%), and Immigrants from Ghana (6.1%, a difference of 1.1%).
| Demographics | Rating | Rank | Unemployment |
| Ghanaians | 0.0 /100 | #278 | Tragic 6.0% |
| Immigrants | Mexico | 0.0 /100 | #279 | Tragic 6.0% |
| Immigrants | Western Africa | 0.0 /100 | #280 | Tragic 6.0% |
| Africans | 0.0 /100 | #281 | Tragic 6.1% |
| Immigrants | Azores | 0.0 /100 | #282 | Tragic 6.1% |
| Immigrants | Ghana | 0.0 /100 | #283 | Tragic 6.1% |
| Aleuts | 0.0 /100 | #284 | Tragic 6.1% |
| Immigrants | Senegal | 0.0 /100 | #285 | Tragic 6.1% |
| Immigrants | Caribbean | 0.0 /100 | #286 | Tragic 6.2% |
| Nepalese | 0.0 /100 | #287 | Tragic 6.2% |
| Ecuadorians | 0.0 /100 | #288 | Tragic 6.2% |
| Chippewa | 0.0 /100 | #289 | Tragic 6.2% |
| Senegalese | 0.0 /100 | #290 | Tragic 6.2% |
| Haitians | 0.0 /100 | #291 | Tragic 6.2% |
| Central American Indians | 0.0 /100 | #292 | Tragic 6.2% |