Immigrants from Laos vs Immigrants from Senegal Single Father Households
COMPARE
Immigrants from Laos
Immigrants from Senegal
Single Father Households
Single Father Households Comparison
Immigrants from Laos
Immigrants from Senegal
2.9%
SINGLE FATHER HOUSEHOLDS
0.0/ 100
METRIC RATING
310th/ 347
METRIC RANK
2.3%
SINGLE FATHER HOUSEHOLDS
79.4/ 100
METRIC RATING
158th/ 347
METRIC RANK
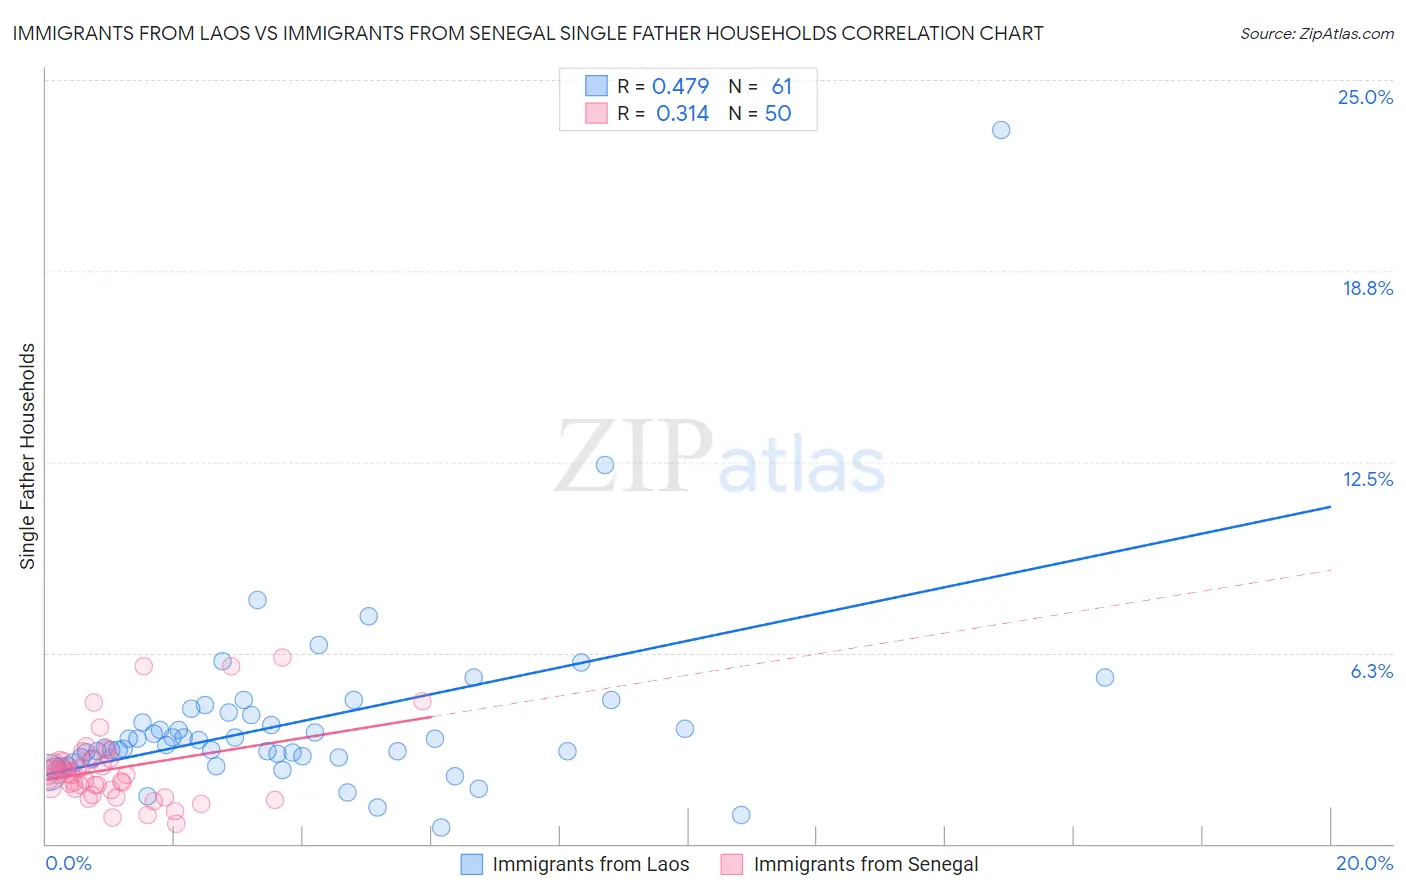
Immigrants from Laos vs Immigrants from Senegal Single Father Households Correlation Chart
The statistical analysis conducted on geographies consisting of 201,026,896 people shows a moderate positive correlation between the proportion of Immigrants from Laos and percentage of single father households in the United States with a correlation coefficient (R) of 0.479 and weighted average of 2.9%. Similarly, the statistical analysis conducted on geographies consisting of 90,010,834 people shows a mild positive correlation between the proportion of Immigrants from Senegal and percentage of single father households in the United States with a correlation coefficient (R) of 0.314 and weighted average of 2.3%, a difference of 25.5%.
Single Father Households Correlation Summary
| Measurement | Immigrants from Laos | Immigrants from Senegal |
| Minimum | 0.53% | 0.67% |
| Maximum | 23.4% | 6.1% |
| Range | 22.8% | 5.4% |
| Mean | 4.0% | 2.5% |
| Median | 3.2% | 2.3% |
| Interquartile 25% (IQ1) | 2.8% | 1.8% |
| Interquartile 75% (IQ3) | 4.3% | 2.7% |
| Interquartile Range (IQR) | 1.5% | 0.93% |
| Standard Deviation (Sample) | 3.1% | 1.2% |
| Standard Deviation (Population) | 3.1% | 1.2% |
Similar Demographics by Single Father Households
Demographics Similar to Immigrants from Laos by Single Father Households
In terms of single father households, the demographic groups most similar to Immigrants from Laos are Central American (2.9%, a difference of 0.21%), Spanish American Indian (2.9%, a difference of 0.48%), Apache (2.8%, a difference of 0.92%), Tsimshian (2.9%, a difference of 1.1%), and Hopi (2.8%, a difference of 1.1%).
| Demographics | Rating | Rank | Single Father Households |
| Immigrants | Honduras | 0.0 /100 | #303 | Tragic 2.8% |
| Mexican American Indians | 0.0 /100 | #304 | Tragic 2.8% |
| Hispanics or Latinos | 0.0 /100 | #305 | Tragic 2.8% |
| Immigrants | Azores | 0.0 /100 | #306 | Tragic 2.8% |
| Hopi | 0.0 /100 | #307 | Tragic 2.8% |
| Apache | 0.0 /100 | #308 | Tragic 2.8% |
| Central Americans | 0.0 /100 | #309 | Tragic 2.9% |
| Immigrants | Laos | 0.0 /100 | #310 | Tragic 2.9% |
| Spanish American Indians | 0.0 /100 | #311 | Tragic 2.9% |
| Tsimshian | 0.0 /100 | #312 | Tragic 2.9% |
| Arapaho | 0.0 /100 | #313 | Tragic 2.9% |
| Salvadorans | 0.0 /100 | #314 | Tragic 2.9% |
| Cheyenne | 0.0 /100 | #315 | Tragic 2.9% |
| Houma | 0.0 /100 | #316 | Tragic 2.9% |
| Immigrants | El Salvador | 0.0 /100 | #317 | Tragic 2.9% |
Demographics Similar to Immigrants from Senegal by Single Father Households
In terms of single father households, the demographic groups most similar to Immigrants from Senegal are Canadian (2.3%, a difference of 0.030%), Immigrants from South America (2.3%, a difference of 0.050%), European (2.3%, a difference of 0.17%), Immigrants from West Indies (2.3%, a difference of 0.17%), and Bolivian (2.3%, a difference of 0.19%).
| Demographics | Rating | Rank | Single Father Households |
| Immigrants | Syria | 84.8 /100 | #151 | Excellent 2.3% |
| Immigrants | Venezuela | 83.2 /100 | #152 | Excellent 2.3% |
| Immigrants | Germany | 82.8 /100 | #153 | Excellent 2.3% |
| Bolivians | 81.0 /100 | #154 | Excellent 2.3% |
| Europeans | 80.9 /100 | #155 | Excellent 2.3% |
| Immigrants | South America | 79.9 /100 | #156 | Good 2.3% |
| Canadians | 79.7 /100 | #157 | Good 2.3% |
| Immigrants | Senegal | 79.4 /100 | #158 | Good 2.3% |
| Immigrants | West Indies | 77.9 /100 | #159 | Good 2.3% |
| Immigrants | Bolivia | 76.3 /100 | #160 | Good 2.3% |
| Swiss | 73.2 /100 | #161 | Good 2.3% |
| Scottish | 72.8 /100 | #162 | Good 2.3% |
| Irish | 72.1 /100 | #163 | Good 2.3% |
| Pakistanis | 70.6 /100 | #164 | Good 2.3% |
| Scotch-Irish | 69.4 /100 | #165 | Good 2.3% |