Chilean vs Immigrants from Ethiopia Unemployment
COMPARE
Chilean
Immigrants from Ethiopia
Unemployment
Unemployment Comparison
Chileans
Immigrants from Ethiopia
5.0%
UNEMPLOYMENT
93.2/ 100
METRIC RATING
111th/ 347
METRIC RANK
5.1%
UNEMPLOYMENT
86.7/ 100
METRIC RATING
132nd/ 347
METRIC RANK
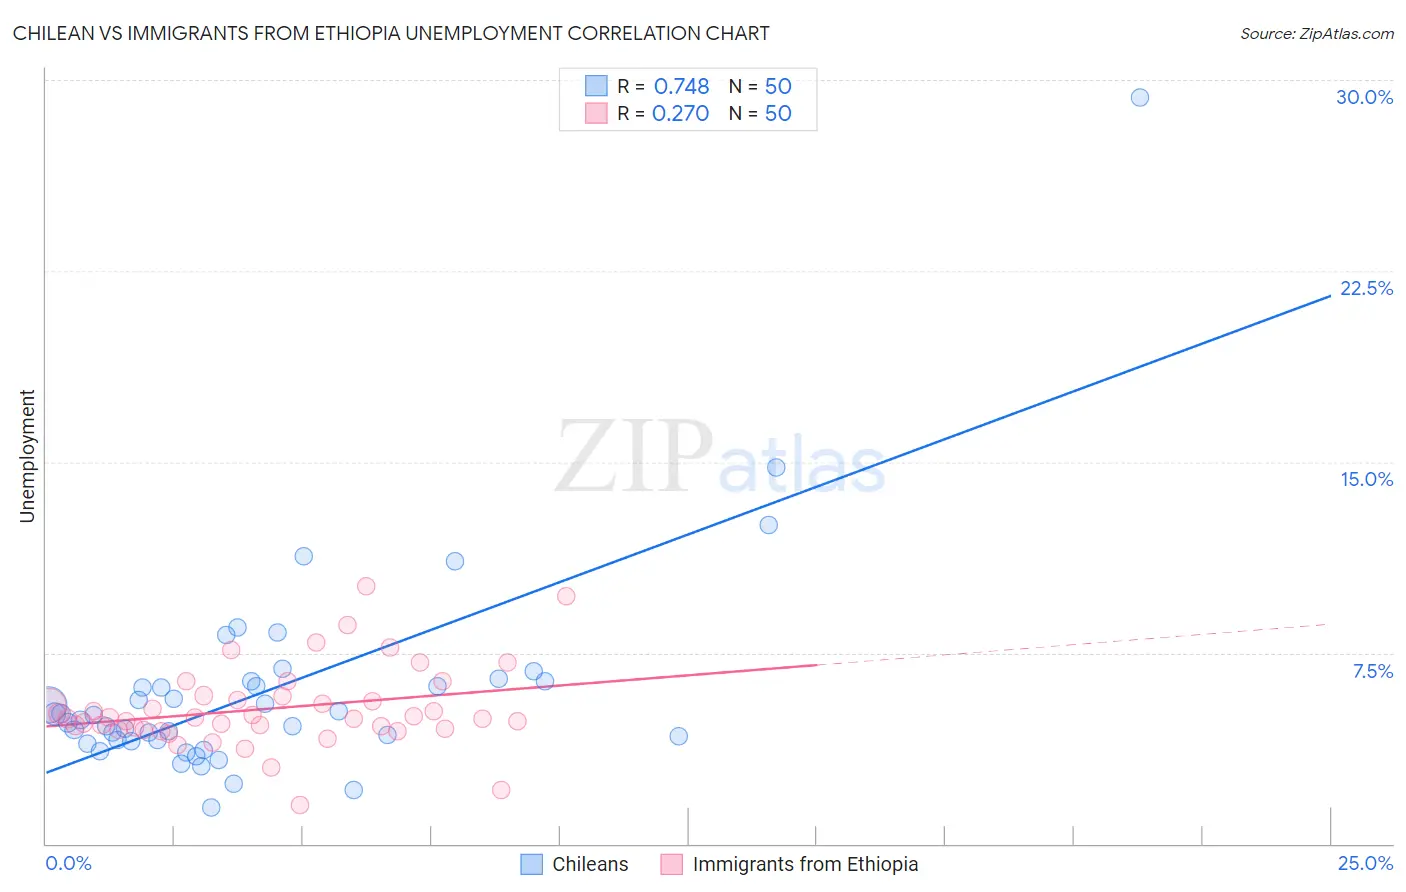
Chilean vs Immigrants from Ethiopia Unemployment Correlation Chart
The statistical analysis conducted on geographies consisting of 256,557,466 people shows a strong positive correlation between the proportion of Chileans and unemployment in the United States with a correlation coefficient (R) of 0.748 and weighted average of 5.0%. Similarly, the statistical analysis conducted on geographies consisting of 211,490,952 people shows a weak positive correlation between the proportion of Immigrants from Ethiopia and unemployment in the United States with a correlation coefficient (R) of 0.270 and weighted average of 5.1%, a difference of 1.2%.
Unemployment Correlation Summary
| Measurement | Chilean | Immigrants from Ethiopia |
| Minimum | 1.4% | 1.5% |
| Maximum | 29.3% | 10.1% |
| Range | 27.9% | 8.6% |
| Mean | 6.0% | 5.3% |
| Median | 5.0% | 4.9% |
| Interquartile 25% (IQ1) | 4.1% | 4.5% |
| Interquartile 75% (IQ3) | 6.4% | 5.8% |
| Interquartile Range (IQR) | 2.3% | 1.3% |
| Standard Deviation (Sample) | 4.2% | 1.6% |
| Standard Deviation (Population) | 4.2% | 1.6% |
Similar Demographics by Unemployment
Demographics Similar to Chileans by Unemployment
In terms of unemployment, the demographic groups most similar to Chileans are Immigrants from Lithuania (5.0%, a difference of 0.0%), Immigrants from Eritrea (5.0%, a difference of 0.020%), Immigrants from Kuwait (5.0%, a difference of 0.12%), Immigrants from Turkey (5.0%, a difference of 0.13%), and Immigrants from Romania (5.0%, a difference of 0.14%).
| Demographics | Rating | Rank | Unemployment |
| Osage | 94.0 /100 | #104 | Exceptional 5.0% |
| Maltese | 94.0 /100 | #105 | Exceptional 5.0% |
| Immigrants | Romania | 93.7 /100 | #106 | Exceptional 5.0% |
| Immigrants | Turkey | 93.7 /100 | #107 | Exceptional 5.0% |
| Immigrants | Kuwait | 93.7 /100 | #108 | Exceptional 5.0% |
| Immigrants | Eritrea | 93.3 /100 | #109 | Exceptional 5.0% |
| Immigrants | Lithuania | 93.2 /100 | #110 | Exceptional 5.0% |
| Chileans | 93.2 /100 | #111 | Exceptional 5.0% |
| South Africans | 92.6 /100 | #112 | Exceptional 5.1% |
| Argentineans | 92.4 /100 | #113 | Exceptional 5.1% |
| Immigrants | Ireland | 92.1 /100 | #114 | Exceptional 5.1% |
| Immigrants | Western Europe | 91.1 /100 | #115 | Exceptional 5.1% |
| Immigrants | Sri Lanka | 91.1 /100 | #116 | Exceptional 5.1% |
| Immigrants | Malaysia | 91.0 /100 | #117 | Exceptional 5.1% |
| Immigrants | Germany | 90.8 /100 | #118 | Exceptional 5.1% |
Demographics Similar to Immigrants from Ethiopia by Unemployment
In terms of unemployment, the demographic groups most similar to Immigrants from Ethiopia are Immigrants from Croatia (5.1%, a difference of 0.010%), Immigrants from Jordan (5.1%, a difference of 0.010%), Iranian (5.1%, a difference of 0.030%), Immigrants from Europe (5.1%, a difference of 0.050%), and Immigrants from Burma/Myanmar (5.1%, a difference of 0.060%).
| Demographics | Rating | Rank | Unemployment |
| Immigrants | Eastern Asia | 88.3 /100 | #125 | Excellent 5.1% |
| Kenyans | 88.2 /100 | #126 | Excellent 5.1% |
| Immigrants | Kenya | 88.2 /100 | #127 | Excellent 5.1% |
| Immigrants | Eastern Africa | 88.1 /100 | #128 | Excellent 5.1% |
| Immigrants | Latvia | 88.0 /100 | #129 | Excellent 5.1% |
| Iranians | 86.9 /100 | #130 | Excellent 5.1% |
| Immigrants | Croatia | 86.8 /100 | #131 | Excellent 5.1% |
| Immigrants | Ethiopia | 86.7 /100 | #132 | Excellent 5.1% |
| Immigrants | Jordan | 86.6 /100 | #133 | Excellent 5.1% |
| Immigrants | Europe | 86.3 /100 | #134 | Excellent 5.1% |
| Immigrants | Burma/Myanmar | 86.2 /100 | #135 | Excellent 5.1% |
| Immigrants | Spain | 86.2 /100 | #136 | Excellent 5.1% |
| Immigrants | Saudi Arabia | 85.6 /100 | #137 | Excellent 5.1% |
| Immigrants | Hungary | 85.6 /100 | #138 | Excellent 5.1% |
| Pakistanis | 85.3 /100 | #139 | Excellent 5.1% |