Immigrants from Northern Africa vs Immigrants from Ethiopia Unemployment
COMPARE
Immigrants from Northern Africa
Immigrants from Ethiopia
Unemployment
Unemployment Comparison
Immigrants from Northern Africa
Immigrants from Ethiopia
5.2%
UNEMPLOYMENT
71.3/ 100
METRIC RATING
155th/ 347
METRIC RANK
5.1%
UNEMPLOYMENT
86.7/ 100
METRIC RATING
132nd/ 347
METRIC RANK
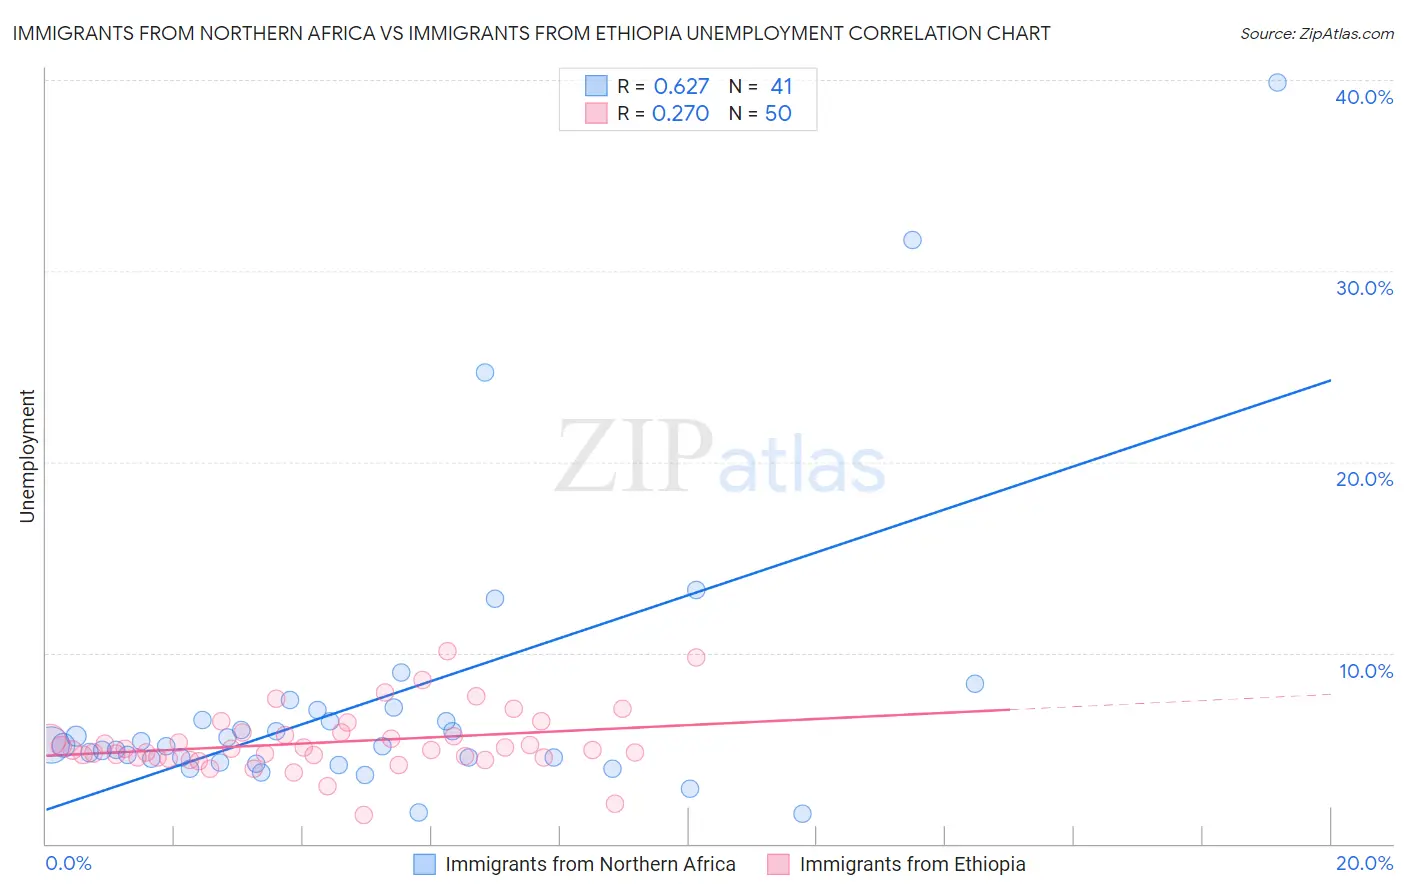
Immigrants from Northern Africa vs Immigrants from Ethiopia Unemployment Correlation Chart
The statistical analysis conducted on geographies consisting of 321,091,849 people shows a significant positive correlation between the proportion of Immigrants from Northern Africa and unemployment in the United States with a correlation coefficient (R) of 0.627 and weighted average of 5.2%. Similarly, the statistical analysis conducted on geographies consisting of 211,490,952 people shows a weak positive correlation between the proportion of Immigrants from Ethiopia and unemployment in the United States with a correlation coefficient (R) of 0.270 and weighted average of 5.1%, a difference of 1.5%.
Unemployment Correlation Summary
| Measurement | Immigrants from Northern Africa | Immigrants from Ethiopia |
| Minimum | 1.6% | 1.5% |
| Maximum | 39.9% | 10.1% |
| Range | 38.3% | 8.6% |
| Mean | 7.5% | 5.3% |
| Median | 5.2% | 4.9% |
| Interquartile 25% (IQ1) | 4.4% | 4.5% |
| Interquartile 75% (IQ3) | 6.7% | 5.8% |
| Interquartile Range (IQR) | 2.4% | 1.3% |
| Standard Deviation (Sample) | 7.5% | 1.6% |
| Standard Deviation (Population) | 7.5% | 1.6% |
Similar Demographics by Unemployment
Demographics Similar to Immigrants from Northern Africa by Unemployment
In terms of unemployment, the demographic groups most similar to Immigrants from Northern Africa are Immigrants from Kazakhstan (5.2%, a difference of 0.070%), Sri Lankan (5.2%, a difference of 0.13%), Immigrants from China (5.2%, a difference of 0.28%), Immigrants from Eastern Europe (5.2%, a difference of 0.32%), and Immigrants from Hong Kong (5.2%, a difference of 0.32%).
| Demographics | Rating | Rank | Unemployment |
| Immigrants | Italy | 79.1 /100 | #148 | Good 5.1% |
| Syrians | 77.7 /100 | #149 | Good 5.2% |
| Potawatomi | 76.2 /100 | #150 | Good 5.2% |
| Immigrants | Eastern Europe | 75.3 /100 | #151 | Good 5.2% |
| Immigrants | Hong Kong | 75.2 /100 | #152 | Good 5.2% |
| Egyptians | 75.2 /100 | #153 | Good 5.2% |
| Immigrants | China | 74.7 /100 | #154 | Good 5.2% |
| Immigrants | Northern Africa | 71.3 /100 | #155 | Good 5.2% |
| Immigrants | Kazakhstan | 70.4 /100 | #156 | Good 5.2% |
| Sri Lankans | 69.5 /100 | #157 | Good 5.2% |
| Immigrants | Egypt | 66.7 /100 | #158 | Good 5.2% |
| Immigrants | Russia | 66.6 /100 | #159 | Good 5.2% |
| Laotians | 66.3 /100 | #160 | Good 5.2% |
| Immigrants | Oceania | 65.2 /100 | #161 | Good 5.2% |
| Spanish | 65.1 /100 | #162 | Good 5.2% |
Demographics Similar to Immigrants from Ethiopia by Unemployment
In terms of unemployment, the demographic groups most similar to Immigrants from Ethiopia are Immigrants from Croatia (5.1%, a difference of 0.010%), Immigrants from Jordan (5.1%, a difference of 0.010%), Iranian (5.1%, a difference of 0.030%), Immigrants from Europe (5.1%, a difference of 0.050%), and Immigrants from Burma/Myanmar (5.1%, a difference of 0.060%).
| Demographics | Rating | Rank | Unemployment |
| Immigrants | Eastern Asia | 88.3 /100 | #125 | Excellent 5.1% |
| Kenyans | 88.2 /100 | #126 | Excellent 5.1% |
| Immigrants | Kenya | 88.2 /100 | #127 | Excellent 5.1% |
| Immigrants | Eastern Africa | 88.1 /100 | #128 | Excellent 5.1% |
| Immigrants | Latvia | 88.0 /100 | #129 | Excellent 5.1% |
| Iranians | 86.9 /100 | #130 | Excellent 5.1% |
| Immigrants | Croatia | 86.8 /100 | #131 | Excellent 5.1% |
| Immigrants | Ethiopia | 86.7 /100 | #132 | Excellent 5.1% |
| Immigrants | Jordan | 86.6 /100 | #133 | Excellent 5.1% |
| Immigrants | Europe | 86.3 /100 | #134 | Excellent 5.1% |
| Immigrants | Burma/Myanmar | 86.2 /100 | #135 | Excellent 5.1% |
| Immigrants | Spain | 86.2 /100 | #136 | Excellent 5.1% |
| Immigrants | Saudi Arabia | 85.6 /100 | #137 | Excellent 5.1% |
| Immigrants | Hungary | 85.6 /100 | #138 | Excellent 5.1% |
| Pakistanis | 85.3 /100 | #139 | Excellent 5.1% |