Lumbee vs Chinese Unemployment
COMPARE
Lumbee
Chinese
Unemployment
Unemployment Comparison
Lumbee
Chinese
6.4%
UNEMPLOYMENT
0.0/ 100
METRIC RATING
306th/ 347
METRIC RANK
4.7%
UNEMPLOYMENT
99.9/ 100
METRIC RATING
16th/ 347
METRIC RANK
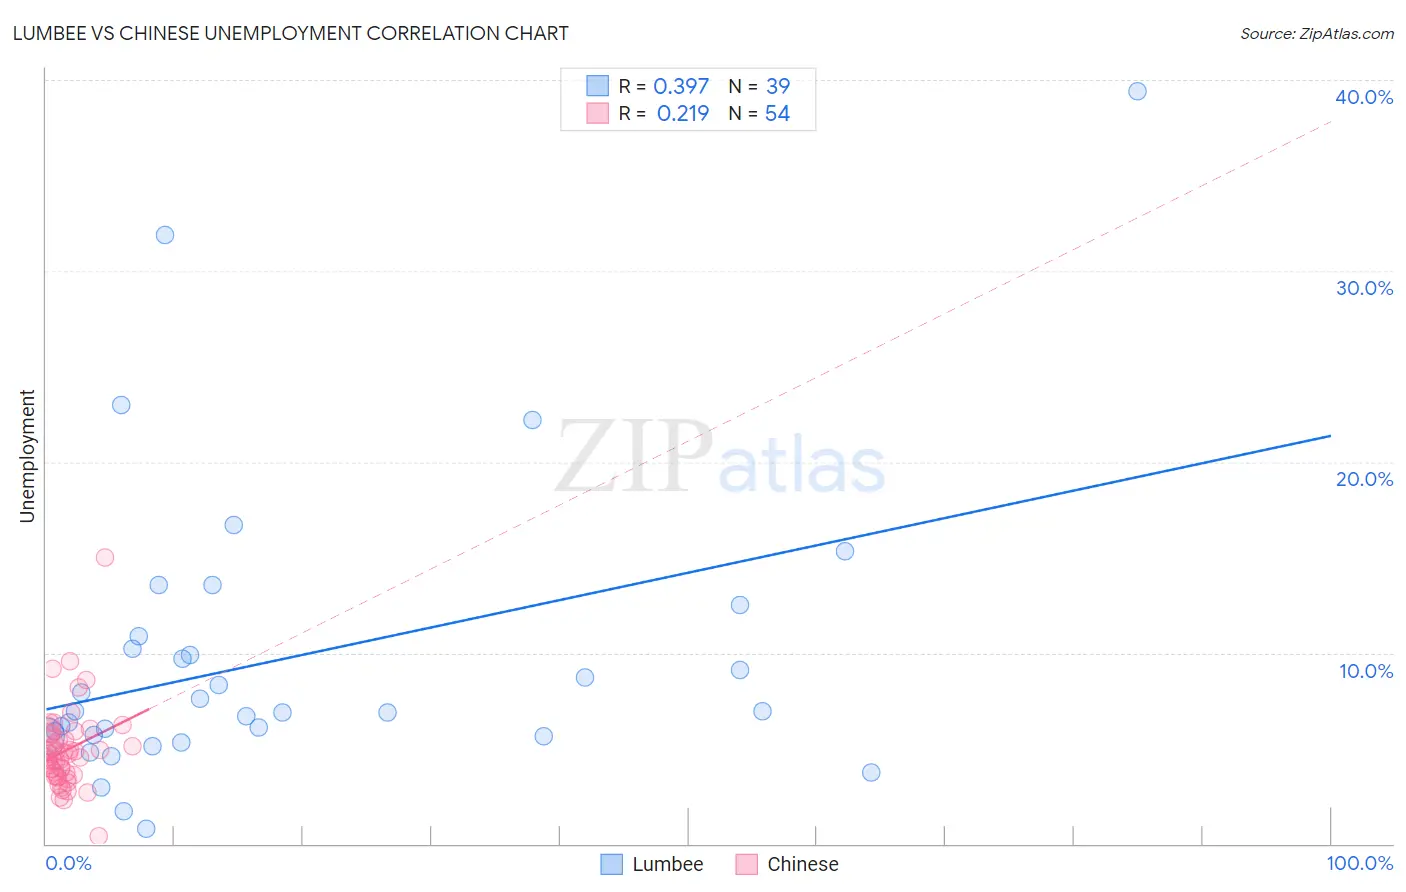
Lumbee vs Chinese Unemployment Correlation Chart
The statistical analysis conducted on geographies consisting of 92,248,032 people shows a mild positive correlation between the proportion of Lumbee and unemployment in the United States with a correlation coefficient (R) of 0.397 and weighted average of 6.4%. Similarly, the statistical analysis conducted on geographies consisting of 64,790,103 people shows a weak positive correlation between the proportion of Chinese and unemployment in the United States with a correlation coefficient (R) of 0.219 and weighted average of 4.7%, a difference of 38.4%.
Unemployment Correlation Summary
| Measurement | Lumbee | Chinese |
| Minimum | 0.80% | 0.40% |
| Maximum | 39.4% | 15.0% |
| Range | 38.6% | 14.6% |
| Mean | 9.8% | 4.9% |
| Median | 6.9% | 4.6% |
| Interquartile 25% (IQ1) | 5.6% | 3.6% |
| Interquartile 75% (IQ3) | 10.9% | 5.8% |
| Interquartile Range (IQR) | 5.2% | 2.2% |
| Standard Deviation (Sample) | 7.8% | 2.2% |
| Standard Deviation (Population) | 7.7% | 2.2% |
Similar Demographics by Unemployment
Demographics Similar to Lumbee by Unemployment
In terms of unemployment, the demographic groups most similar to Lumbee are Menominee (6.4%, a difference of 0.030%), Immigrants from Jamaica (6.4%, a difference of 0.29%), Immigrants from Bangladesh (6.5%, a difference of 0.48%), Barbadian (6.5%, a difference of 0.86%), and Vietnamese (6.5%, a difference of 0.87%).
| Demographics | Rating | Rank | Unemployment |
| Immigrants | West Indies | 0.0 /100 | #299 | Tragic 6.3% |
| Immigrants | Trinidad and Tobago | 0.0 /100 | #300 | Tragic 6.3% |
| Trinidadians and Tobagonians | 0.0 /100 | #301 | Tragic 6.3% |
| West Indians | 0.0 /100 | #302 | Tragic 6.4% |
| Belizeans | 0.0 /100 | #303 | Tragic 6.4% |
| Immigrants | Jamaica | 0.0 /100 | #304 | Tragic 6.4% |
| Menominee | 0.0 /100 | #305 | Tragic 6.4% |
| Lumbee | 0.0 /100 | #306 | Tragic 6.4% |
| Immigrants | Bangladesh | 0.0 /100 | #307 | Tragic 6.5% |
| Barbadians | 0.0 /100 | #308 | Tragic 6.5% |
| Vietnamese | 0.0 /100 | #309 | Tragic 6.5% |
| Immigrants | Belize | 0.0 /100 | #310 | Tragic 6.5% |
| Cape Verdeans | 0.0 /100 | #311 | Tragic 6.5% |
| Colville | 0.0 /100 | #312 | Tragic 6.6% |
| Immigrants | Barbados | 0.0 /100 | #313 | Tragic 6.6% |
Demographics Similar to Chinese by Unemployment
In terms of unemployment, the demographic groups most similar to Chinese are Slovene (4.7%, a difference of 0.10%), Immigrants from Venezuela (4.7%, a difference of 0.13%), European (4.6%, a difference of 0.14%), Scottish (4.7%, a difference of 0.21%), and Immigrants from Cuba (4.6%, a difference of 0.62%).
| Demographics | Rating | Rank | Unemployment |
| Scandinavians | 100.0 /100 | #9 | Exceptional 4.5% |
| Dutch | 100.0 /100 | #10 | Exceptional 4.6% |
| English | 100.0 /100 | #11 | Exceptional 4.6% |
| Pennsylvania Germans | 100.0 /100 | #12 | Exceptional 4.6% |
| Belgians | 100.0 /100 | #13 | Exceptional 4.6% |
| Immigrants | Cuba | 100.0 /100 | #14 | Exceptional 4.6% |
| Europeans | 99.9 /100 | #15 | Exceptional 4.6% |
| Chinese | 99.9 /100 | #16 | Exceptional 4.7% |
| Slovenes | 99.9 /100 | #17 | Exceptional 4.7% |
| Immigrants | Venezuela | 99.9 /100 | #18 | Exceptional 4.7% |
| Scottish | 99.9 /100 | #19 | Exceptional 4.7% |
| Carpatho Rusyns | 99.9 /100 | #20 | Exceptional 4.7% |
| Welsh | 99.9 /100 | #21 | Exceptional 4.7% |
| Thais | 99.9 /100 | #22 | Exceptional 4.7% |
| British | 99.9 /100 | #23 | Exceptional 4.7% |