Immigrants from Costa Rica vs Cheyenne Unemployment
COMPARE
Immigrants from Costa Rica
Cheyenne
Unemployment
Unemployment Comparison
Immigrants from Costa Rica
Cheyenne
5.4%
UNEMPLOYMENT
15.2/ 100
METRIC RATING
214th/ 347
METRIC RANK
8.0%
UNEMPLOYMENT
0.0/ 100
METRIC RATING
337th/ 347
METRIC RANK
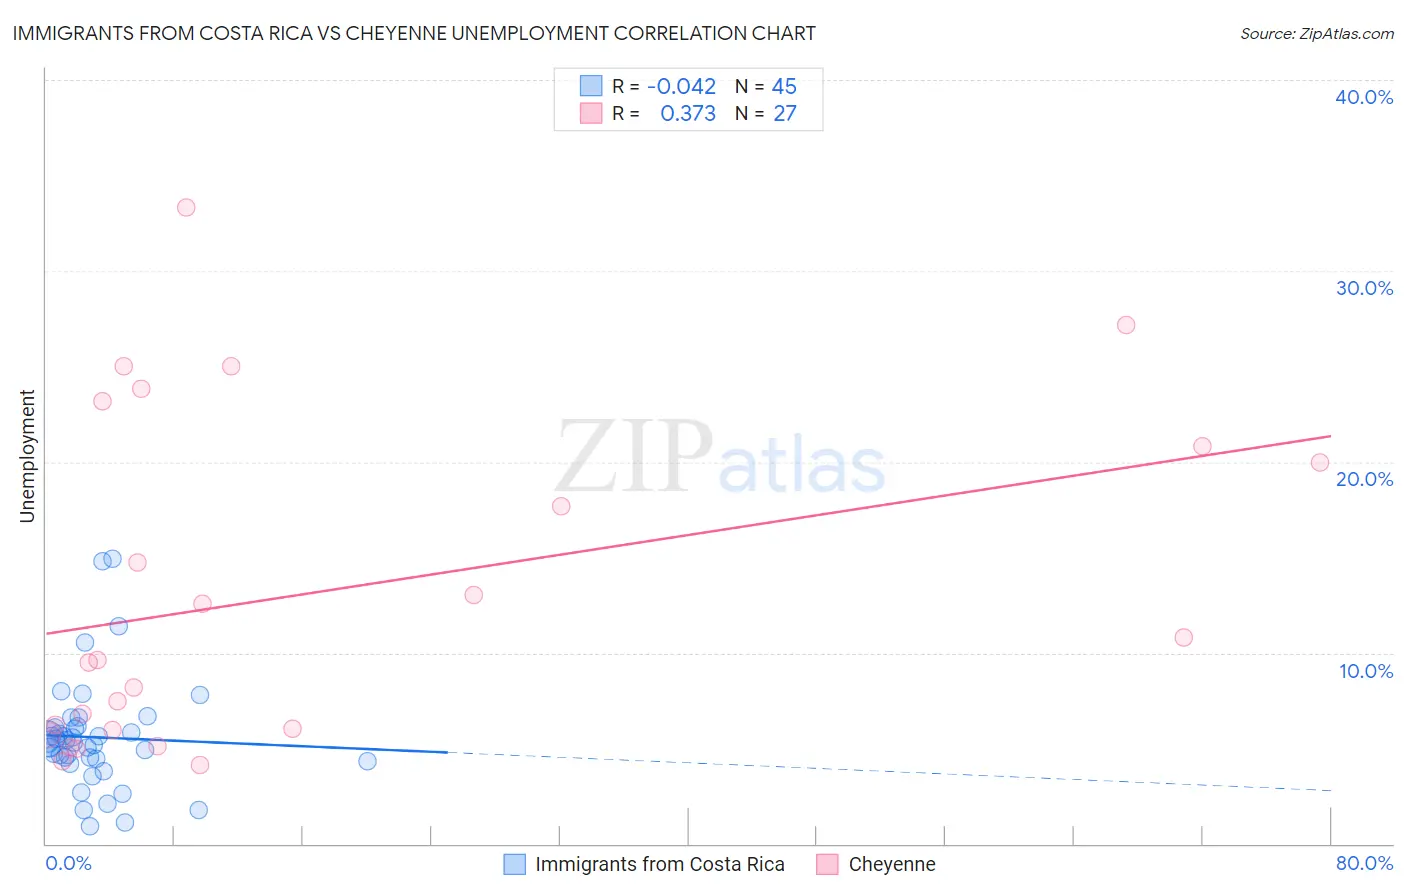
Immigrants from Costa Rica vs Cheyenne Unemployment Correlation Chart
The statistical analysis conducted on geographies consisting of 204,222,617 people shows no correlation between the proportion of Immigrants from Costa Rica and unemployment in the United States with a correlation coefficient (R) of -0.042 and weighted average of 5.4%. Similarly, the statistical analysis conducted on geographies consisting of 80,656,490 people shows a mild positive correlation between the proportion of Cheyenne and unemployment in the United States with a correlation coefficient (R) of 0.373 and weighted average of 8.0%, a difference of 48.3%.
Unemployment Correlation Summary
| Measurement | Immigrants from Costa Rica | Cheyenne |
| Minimum | 0.95% | 4.1% |
| Maximum | 14.9% | 33.3% |
| Range | 14.0% | 29.2% |
| Mean | 5.6% | 13.2% |
| Median | 5.3% | 9.6% |
| Interquartile 25% (IQ1) | 4.4% | 6.0% |
| Interquartile 75% (IQ3) | 6.1% | 20.8% |
| Interquartile Range (IQR) | 1.7% | 14.8% |
| Standard Deviation (Sample) | 2.9% | 8.6% |
| Standard Deviation (Population) | 2.9% | 8.4% |
Similar Demographics by Unemployment
Demographics Similar to Immigrants from Costa Rica by Unemployment
In terms of unemployment, the demographic groups most similar to Immigrants from Costa Rica are Immigrants from Middle Africa (5.4%, a difference of 0.0%), Delaware (5.4%, a difference of 0.060%), Immigrants from South America (5.4%, a difference of 0.22%), Immigrants from Albania (5.4%, a difference of 0.22%), and Ugandan (5.4%, a difference of 0.30%).
| Demographics | Rating | Rank | Unemployment |
| Creek | 19.4 /100 | #207 | Poor 5.4% |
| Portuguese | 19.0 /100 | #208 | Poor 5.4% |
| Immigrants | Iran | 18.8 /100 | #209 | Poor 5.4% |
| Immigrants | Iraq | 18.6 /100 | #210 | Poor 5.4% |
| Iraqis | 18.1 /100 | #211 | Poor 5.4% |
| Ugandans | 18.0 /100 | #212 | Poor 5.4% |
| Immigrants | Middle Africa | 15.3 /100 | #213 | Poor 5.4% |
| Immigrants | Costa Rica | 15.2 /100 | #214 | Poor 5.4% |
| Delaware | 14.7 /100 | #215 | Poor 5.4% |
| Immigrants | South America | 13.5 /100 | #216 | Poor 5.4% |
| Immigrants | Albania | 13.5 /100 | #217 | Poor 5.4% |
| Choctaw | 12.7 /100 | #218 | Poor 5.4% |
| Bangladeshis | 11.2 /100 | #219 | Poor 5.4% |
| Soviet Union | 10.6 /100 | #220 | Poor 5.4% |
| Immigrants | Philippines | 10.4 /100 | #221 | Poor 5.4% |
Demographics Similar to Cheyenne by Unemployment
In terms of unemployment, the demographic groups most similar to Cheyenne are Pima (8.2%, a difference of 2.8%), Immigrants from Yemen (7.7%, a difference of 3.8%), Navajo (8.4%, a difference of 4.4%), Alaskan Athabascan (7.7%, a difference of 4.6%), and Puerto Rican (8.4%, a difference of 5.2%).
| Demographics | Rating | Rank | Unemployment |
| Yakama | 0.0 /100 | #330 | Tragic 7.3% |
| Dominicans | 0.0 /100 | #331 | Tragic 7.4% |
| Sioux | 0.0 /100 | #332 | Tragic 7.4% |
| Immigrants | Dominican Republic | 0.0 /100 | #333 | Tragic 7.4% |
| Apache | 0.0 /100 | #334 | Tragic 7.4% |
| Alaskan Athabascans | 0.0 /100 | #335 | Tragic 7.7% |
| Immigrants | Yemen | 0.0 /100 | #336 | Tragic 7.7% |
| Cheyenne | 0.0 /100 | #337 | Tragic 8.0% |
| Pima | 0.0 /100 | #338 | Tragic 8.2% |
| Navajo | 0.0 /100 | #339 | Tragic 8.4% |
| Puerto Ricans | 0.0 /100 | #340 | Tragic 8.4% |
| Tohono O'odham | 0.0 /100 | #341 | Tragic 8.9% |
| Hopi | 0.0 /100 | #342 | Tragic 8.9% |
| Yuman | 0.0 /100 | #343 | Tragic 9.1% |
| Arapaho | 0.0 /100 | #344 | Tragic 9.8% |