Zimbabwean vs Cheyenne Unemployment
COMPARE
Zimbabwean
Cheyenne
Unemployment
Unemployment Comparison
Zimbabweans
Cheyenne
4.8%
UNEMPLOYMENT
99.8/ 100
METRIC RATING
32nd/ 347
METRIC RANK
8.0%
UNEMPLOYMENT
0.0/ 100
METRIC RATING
337th/ 347
METRIC RANK
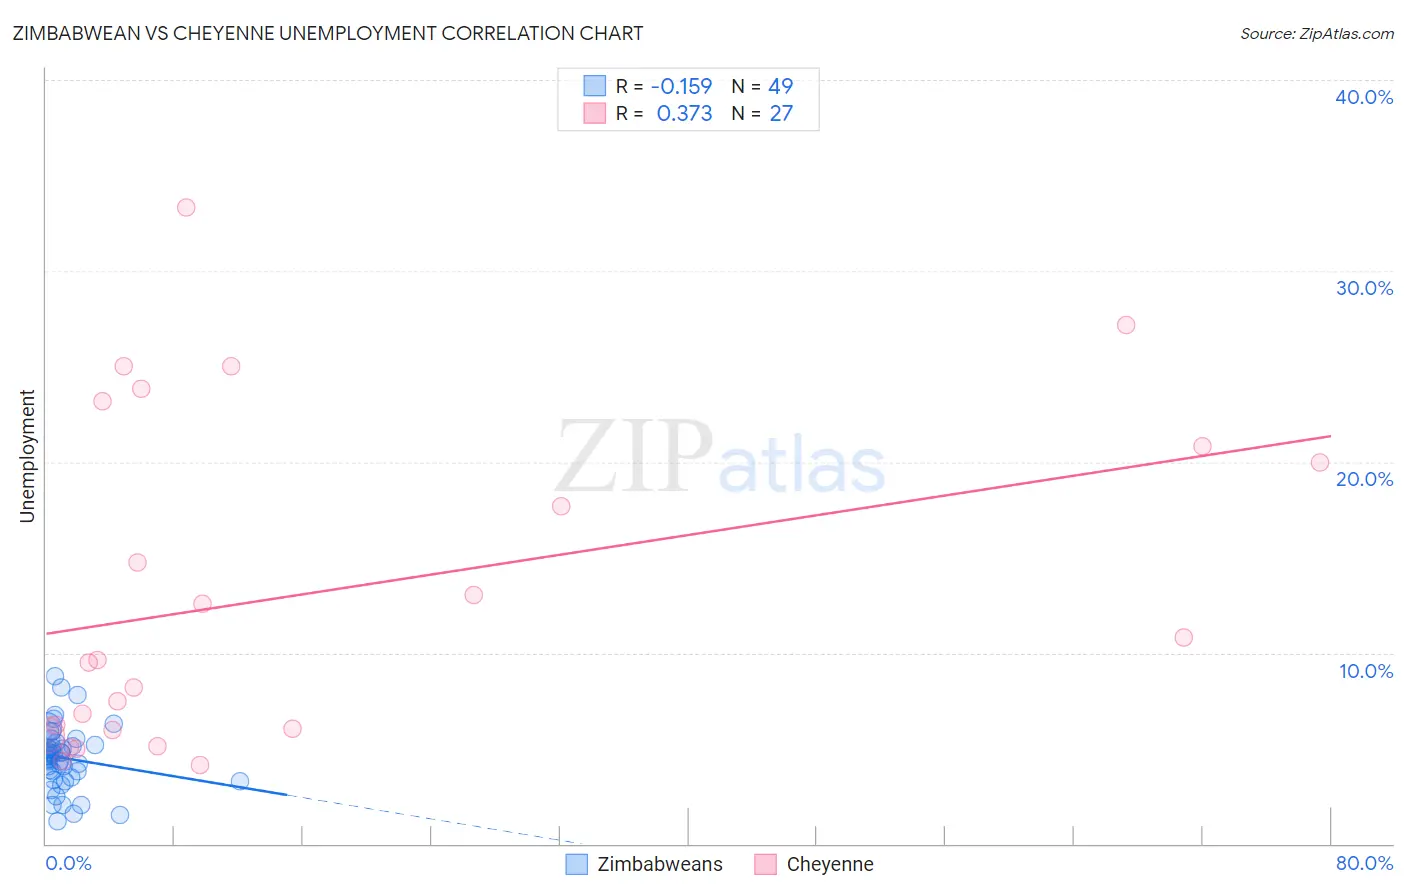
Zimbabwean vs Cheyenne Unemployment Correlation Chart
The statistical analysis conducted on geographies consisting of 69,206,106 people shows a poor negative correlation between the proportion of Zimbabweans and unemployment in the United States with a correlation coefficient (R) of -0.159 and weighted average of 4.8%. Similarly, the statistical analysis conducted on geographies consisting of 80,656,490 people shows a mild positive correlation between the proportion of Cheyenne and unemployment in the United States with a correlation coefficient (R) of 0.373 and weighted average of 8.0%, a difference of 68.0%.
Unemployment Correlation Summary
| Measurement | Zimbabwean | Cheyenne |
| Minimum | 1.2% | 4.1% |
| Maximum | 8.8% | 33.3% |
| Range | 7.6% | 29.2% |
| Mean | 4.5% | 13.2% |
| Median | 4.6% | 9.6% |
| Interquartile 25% (IQ1) | 3.4% | 6.0% |
| Interquartile 75% (IQ3) | 5.2% | 20.8% |
| Interquartile Range (IQR) | 1.8% | 14.8% |
| Standard Deviation (Sample) | 1.6% | 8.6% |
| Standard Deviation (Population) | 1.6% | 8.4% |
Similar Demographics by Unemployment
Demographics Similar to Zimbabweans by Unemployment
In terms of unemployment, the demographic groups most similar to Zimbabweans are Sudanese (4.8%, a difference of 0.010%), Immigrants from Bolivia (4.8%, a difference of 0.050%), Croatian (4.8%, a difference of 0.10%), Irish (4.8%, a difference of 0.12%), and Scotch-Irish (4.8%, a difference of 0.12%).
| Demographics | Rating | Rank | Unemployment |
| Latvians | 99.9 /100 | #25 | Exceptional 4.7% |
| Bulgarians | 99.9 /100 | #26 | Exceptional 4.7% |
| Finns | 99.9 /100 | #27 | Exceptional 4.7% |
| Cubans | 99.8 /100 | #28 | Exceptional 4.7% |
| Poles | 99.8 /100 | #29 | Exceptional 4.7% |
| Irish | 99.8 /100 | #30 | Exceptional 4.8% |
| Croatians | 99.8 /100 | #31 | Exceptional 4.8% |
| Zimbabweans | 99.8 /100 | #32 | Exceptional 4.8% |
| Sudanese | 99.8 /100 | #33 | Exceptional 4.8% |
| Immigrants | Bolivia | 99.8 /100 | #34 | Exceptional 4.8% |
| Scotch-Irish | 99.8 /100 | #35 | Exceptional 4.8% |
| Tongans | 99.7 /100 | #36 | Exceptional 4.8% |
| Czechoslovakians | 99.7 /100 | #37 | Exceptional 4.8% |
| Bolivians | 99.7 /100 | #38 | Exceptional 4.8% |
| Lithuanians | 99.7 /100 | #39 | Exceptional 4.8% |
Demographics Similar to Cheyenne by Unemployment
In terms of unemployment, the demographic groups most similar to Cheyenne are Pima (8.2%, a difference of 2.8%), Immigrants from Yemen (7.7%, a difference of 3.8%), Navajo (8.4%, a difference of 4.4%), Alaskan Athabascan (7.7%, a difference of 4.6%), and Puerto Rican (8.4%, a difference of 5.2%).
| Demographics | Rating | Rank | Unemployment |
| Yakama | 0.0 /100 | #330 | Tragic 7.3% |
| Dominicans | 0.0 /100 | #331 | Tragic 7.4% |
| Sioux | 0.0 /100 | #332 | Tragic 7.4% |
| Immigrants | Dominican Republic | 0.0 /100 | #333 | Tragic 7.4% |
| Apache | 0.0 /100 | #334 | Tragic 7.4% |
| Alaskan Athabascans | 0.0 /100 | #335 | Tragic 7.7% |
| Immigrants | Yemen | 0.0 /100 | #336 | Tragic 7.7% |
| Cheyenne | 0.0 /100 | #337 | Tragic 8.0% |
| Pima | 0.0 /100 | #338 | Tragic 8.2% |
| Navajo | 0.0 /100 | #339 | Tragic 8.4% |
| Puerto Ricans | 0.0 /100 | #340 | Tragic 8.4% |
| Tohono O'odham | 0.0 /100 | #341 | Tragic 8.9% |
| Hopi | 0.0 /100 | #342 | Tragic 8.9% |
| Yuman | 0.0 /100 | #343 | Tragic 9.1% |
| Arapaho | 0.0 /100 | #344 | Tragic 9.8% |