Immigrants from Armenia vs Immigrants from Cuba Unemployment
COMPARE
Immigrants from Armenia
Immigrants from Cuba
Unemployment
Unemployment Comparison
Immigrants from Armenia
Immigrants from Cuba
7.0%
UNEMPLOYMENT
0.0/ 100
METRIC RATING
324th/ 347
METRIC RANK
4.6%
UNEMPLOYMENT
100.0/ 100
METRIC RATING
14th/ 347
METRIC RANK
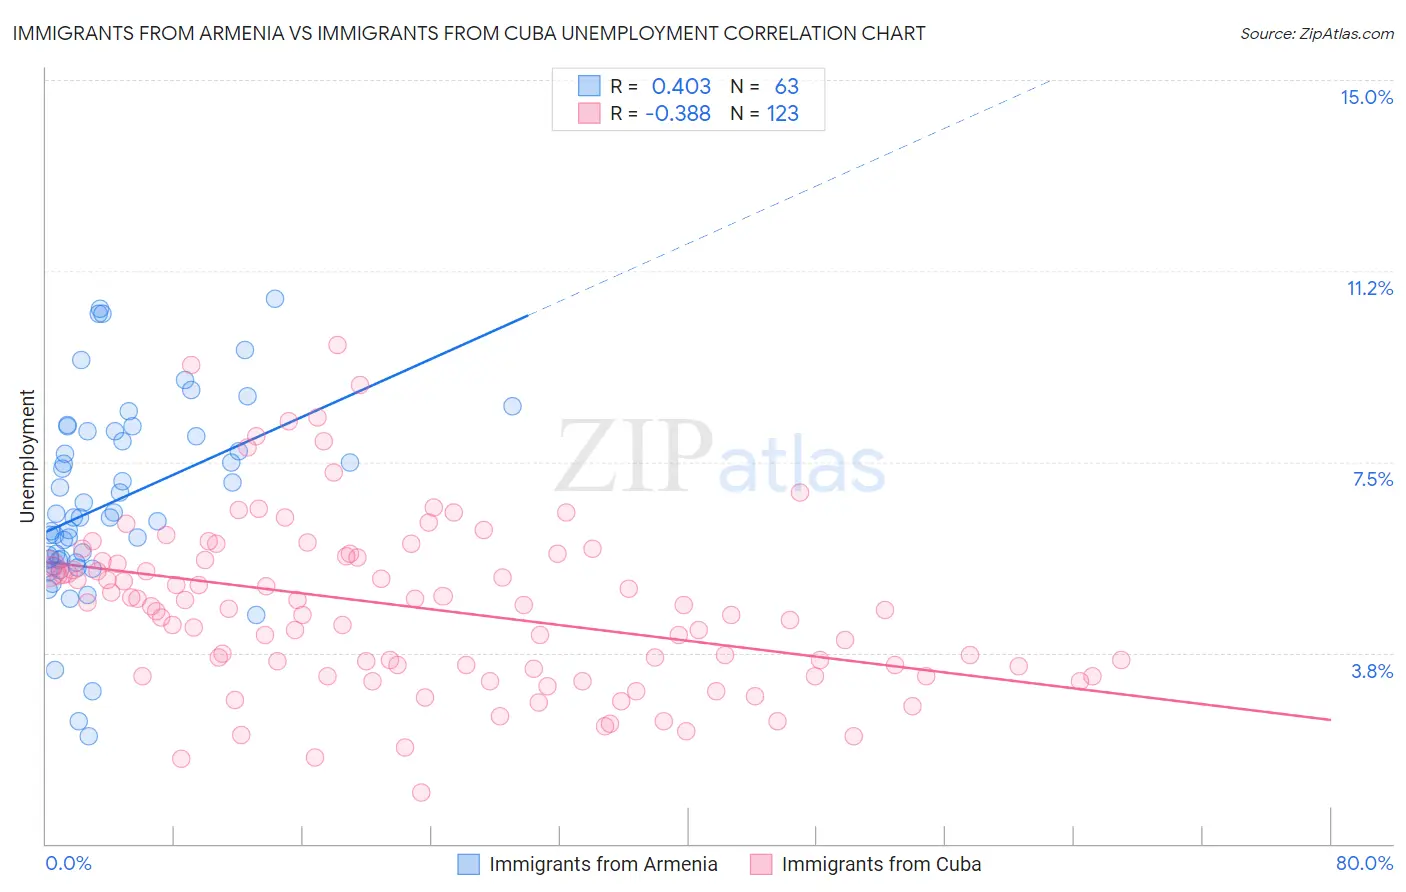
Immigrants from Armenia vs Immigrants from Cuba Unemployment Correlation Chart
The statistical analysis conducted on geographies consisting of 97,707,346 people shows a moderate positive correlation between the proportion of Immigrants from Armenia and unemployment in the United States with a correlation coefficient (R) of 0.403 and weighted average of 7.0%. Similarly, the statistical analysis conducted on geographies consisting of 325,813,877 people shows a mild negative correlation between the proportion of Immigrants from Cuba and unemployment in the United States with a correlation coefficient (R) of -0.388 and weighted average of 4.6%, a difference of 51.3%.
Unemployment Correlation Summary
| Measurement | Immigrants from Armenia | Immigrants from Cuba |
| Minimum | 2.1% | 1.0% |
| Maximum | 10.7% | 9.8% |
| Range | 8.6% | 8.8% |
| Mean | 6.7% | 4.6% |
| Median | 6.4% | 4.7% |
| Interquartile 25% (IQ1) | 5.6% | 3.4% |
| Interquartile 75% (IQ3) | 8.1% | 5.6% |
| Interquartile Range (IQR) | 2.5% | 2.2% |
| Standard Deviation (Sample) | 1.9% | 1.7% |
| Standard Deviation (Population) | 1.9% | 1.7% |
Similar Demographics by Unemployment
Demographics Similar to Immigrants from Armenia by Unemployment
In terms of unemployment, the demographic groups most similar to Immigrants from Armenia are Native/Alaskan (7.0%, a difference of 0.56%), Immigrants from Grenada (6.9%, a difference of 1.2%), Guyanese (6.9%, a difference of 1.5%), Immigrants from Guyana (6.9%, a difference of 1.5%), and Immigrants from St. Vincent and the Grenadines (6.9%, a difference of 1.5%).
| Demographics | Rating | Rank | Unemployment |
| Shoshone | 0.0 /100 | #317 | Tragic 6.8% |
| Immigrants | Cabo Verde | 0.0 /100 | #318 | Tragic 6.8% |
| British West Indians | 0.0 /100 | #319 | Tragic 6.8% |
| Immigrants | St. Vincent and the Grenadines | 0.0 /100 | #320 | Tragic 6.9% |
| Immigrants | Guyana | 0.0 /100 | #321 | Tragic 6.9% |
| Guyanese | 0.0 /100 | #322 | Tragic 6.9% |
| Immigrants | Grenada | 0.0 /100 | #323 | Tragic 6.9% |
| Immigrants | Armenia | 0.0 /100 | #324 | Tragic 7.0% |
| Natives/Alaskans | 0.0 /100 | #325 | Tragic 7.0% |
| Paiute | 0.0 /100 | #326 | Tragic 7.1% |
| Pueblo | 0.0 /100 | #327 | Tragic 7.2% |
| Tsimshian | 0.0 /100 | #328 | Tragic 7.2% |
| Alaska Natives | 0.0 /100 | #329 | Tragic 7.2% |
| Yakama | 0.0 /100 | #330 | Tragic 7.3% |
| Dominicans | 0.0 /100 | #331 | Tragic 7.4% |
Demographics Similar to Immigrants from Cuba by Unemployment
In terms of unemployment, the demographic groups most similar to Immigrants from Cuba are Belgian (4.6%, a difference of 0.24%), Pennsylvania German (4.6%, a difference of 0.40%), European (4.6%, a difference of 0.48%), English (4.6%, a difference of 0.50%), and Chinese (4.7%, a difference of 0.62%).
| Demographics | Rating | Rank | Unemployment |
| Immigrants | India | 100.0 /100 | #7 | Exceptional 4.5% |
| Swiss | 100.0 /100 | #8 | Exceptional 4.5% |
| Scandinavians | 100.0 /100 | #9 | Exceptional 4.5% |
| Dutch | 100.0 /100 | #10 | Exceptional 4.6% |
| English | 100.0 /100 | #11 | Exceptional 4.6% |
| Pennsylvania Germans | 100.0 /100 | #12 | Exceptional 4.6% |
| Belgians | 100.0 /100 | #13 | Exceptional 4.6% |
| Immigrants | Cuba | 100.0 /100 | #14 | Exceptional 4.6% |
| Europeans | 99.9 /100 | #15 | Exceptional 4.6% |
| Chinese | 99.9 /100 | #16 | Exceptional 4.7% |
| Slovenes | 99.9 /100 | #17 | Exceptional 4.7% |
| Immigrants | Venezuela | 99.9 /100 | #18 | Exceptional 4.7% |
| Scottish | 99.9 /100 | #19 | Exceptional 4.7% |
| Carpatho Rusyns | 99.9 /100 | #20 | Exceptional 4.7% |
| Welsh | 99.9 /100 | #21 | Exceptional 4.7% |