Spaniard vs Immigrants from Cuba Unemployment
COMPARE
Spaniard
Immigrants from Cuba
Unemployment
Unemployment Comparison
Spaniards
Immigrants from Cuba
5.3%
UNEMPLOYMENT
42.2/ 100
METRIC RATING
182nd/ 347
METRIC RANK
4.6%
UNEMPLOYMENT
100.0/ 100
METRIC RATING
14th/ 347
METRIC RANK
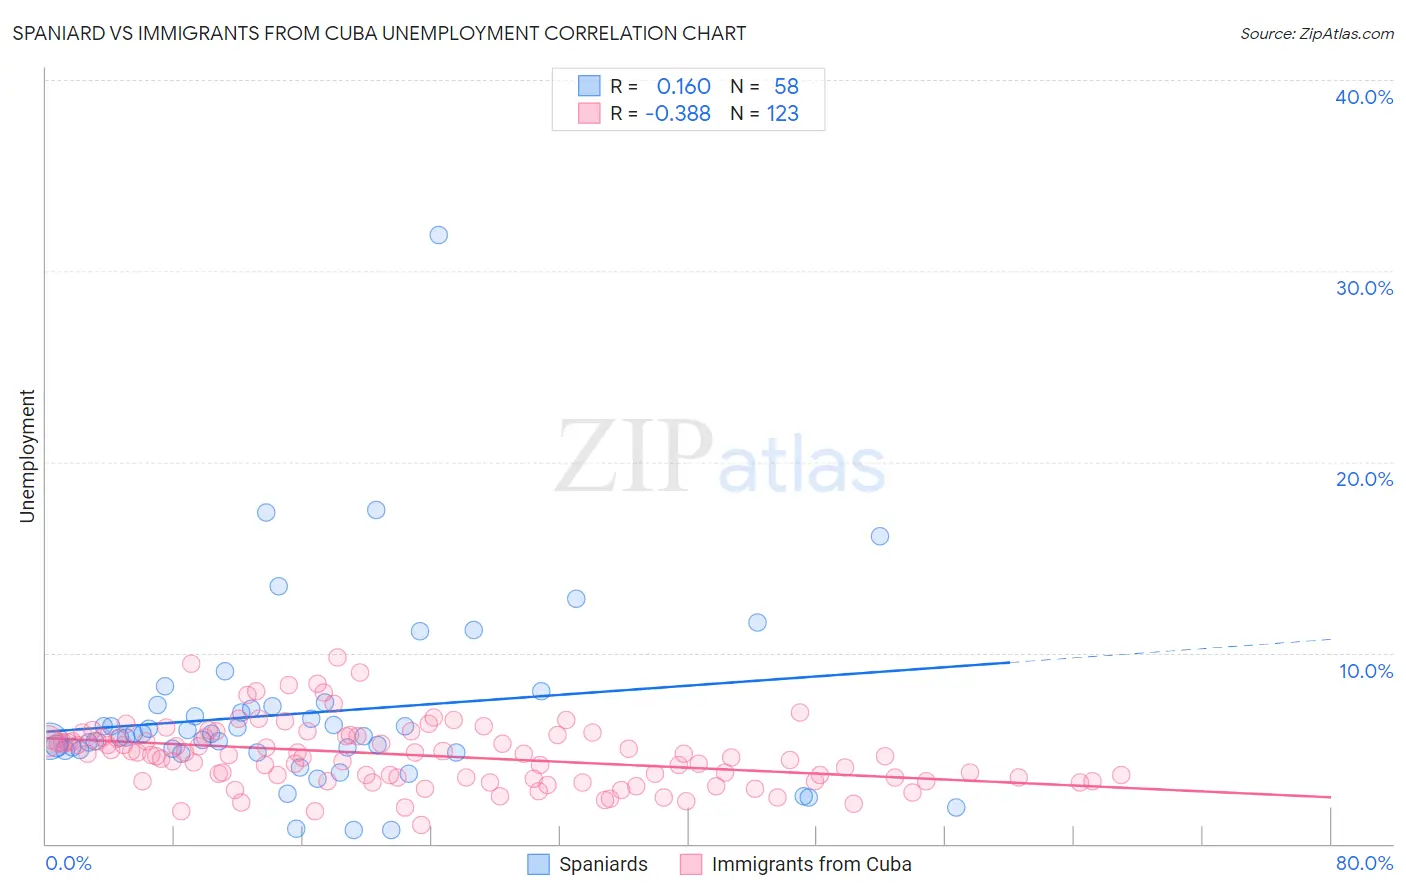
Spaniard vs Immigrants from Cuba Unemployment Correlation Chart
The statistical analysis conducted on geographies consisting of 442,859,385 people shows a poor positive correlation between the proportion of Spaniards and unemployment in the United States with a correlation coefficient (R) of 0.160 and weighted average of 5.3%. Similarly, the statistical analysis conducted on geographies consisting of 325,813,877 people shows a mild negative correlation between the proportion of Immigrants from Cuba and unemployment in the United States with a correlation coefficient (R) of -0.388 and weighted average of 4.6%, a difference of 14.3%.
Unemployment Correlation Summary
| Measurement | Spaniard | Immigrants from Cuba |
| Minimum | 0.70% | 1.0% |
| Maximum | 31.9% | 9.8% |
| Range | 31.2% | 8.8% |
| Mean | 6.8% | 4.6% |
| Median | 5.7% | 4.7% |
| Interquartile 25% (IQ1) | 4.9% | 3.4% |
| Interquartile 75% (IQ3) | 7.2% | 5.6% |
| Interquartile Range (IQR) | 2.3% | 2.2% |
| Standard Deviation (Sample) | 4.9% | 1.7% |
| Standard Deviation (Population) | 4.9% | 1.7% |
Similar Demographics by Unemployment
Demographics Similar to Spaniards by Unemployment
In terms of unemployment, the demographic groups most similar to Spaniards are Albanian (5.3%, a difference of 0.080%), Brazilian (5.3%, a difference of 0.13%), Immigrants from Greece (5.3%, a difference of 0.18%), Assyrian/Chaldean/Syriac (5.3%, a difference of 0.19%), and Immigrants from Thailand (5.3%, a difference of 0.21%).
| Demographics | Rating | Rank | Unemployment |
| Taiwanese | 49.6 /100 | #175 | Average 5.3% |
| Nicaraguans | 48.7 /100 | #176 | Average 5.3% |
| Immigrants | Nonimmigrants | 47.9 /100 | #177 | Average 5.3% |
| Afghans | 47.4 /100 | #178 | Average 5.3% |
| Malaysians | 46.8 /100 | #179 | Average 5.3% |
| Immigrants | Greece | 45.0 /100 | #180 | Average 5.3% |
| Albanians | 43.5 /100 | #181 | Average 5.3% |
| Spaniards | 42.2 /100 | #182 | Average 5.3% |
| Brazilians | 40.2 /100 | #183 | Average 5.3% |
| Assyrians/Chaldeans/Syriacs | 39.2 /100 | #184 | Fair 5.3% |
| Immigrants | Thailand | 38.9 /100 | #185 | Fair 5.3% |
| Immigrants | Uganda | 37.8 /100 | #186 | Fair 5.3% |
| Costa Ricans | 37.4 /100 | #187 | Fair 5.3% |
| Alsatians | 37.0 /100 | #188 | Fair 5.3% |
| Immigrants | Belarus | 35.6 /100 | #189 | Fair 5.3% |
Demographics Similar to Immigrants from Cuba by Unemployment
In terms of unemployment, the demographic groups most similar to Immigrants from Cuba are Belgian (4.6%, a difference of 0.24%), Pennsylvania German (4.6%, a difference of 0.40%), European (4.6%, a difference of 0.48%), English (4.6%, a difference of 0.50%), and Chinese (4.7%, a difference of 0.62%).
| Demographics | Rating | Rank | Unemployment |
| Immigrants | India | 100.0 /100 | #7 | Exceptional 4.5% |
| Swiss | 100.0 /100 | #8 | Exceptional 4.5% |
| Scandinavians | 100.0 /100 | #9 | Exceptional 4.5% |
| Dutch | 100.0 /100 | #10 | Exceptional 4.6% |
| English | 100.0 /100 | #11 | Exceptional 4.6% |
| Pennsylvania Germans | 100.0 /100 | #12 | Exceptional 4.6% |
| Belgians | 100.0 /100 | #13 | Exceptional 4.6% |
| Immigrants | Cuba | 100.0 /100 | #14 | Exceptional 4.6% |
| Europeans | 99.9 /100 | #15 | Exceptional 4.6% |
| Chinese | 99.9 /100 | #16 | Exceptional 4.7% |
| Slovenes | 99.9 /100 | #17 | Exceptional 4.7% |
| Immigrants | Venezuela | 99.9 /100 | #18 | Exceptional 4.7% |
| Scottish | 99.9 /100 | #19 | Exceptional 4.7% |
| Carpatho Rusyns | 99.9 /100 | #20 | Exceptional 4.7% |
| Welsh | 99.9 /100 | #21 | Exceptional 4.7% |