Immigrants from Armenia vs Immigrants from Brazil Unemployment
COMPARE
Immigrants from Armenia
Immigrants from Brazil
Unemployment
Unemployment Comparison
Immigrants from Armenia
Immigrants from Brazil
7.0%
UNEMPLOYMENT
0.0/ 100
METRIC RATING
324th/ 347
METRIC RANK
5.2%
UNEMPLOYMENT
63.1/ 100
METRIC RATING
165th/ 347
METRIC RANK
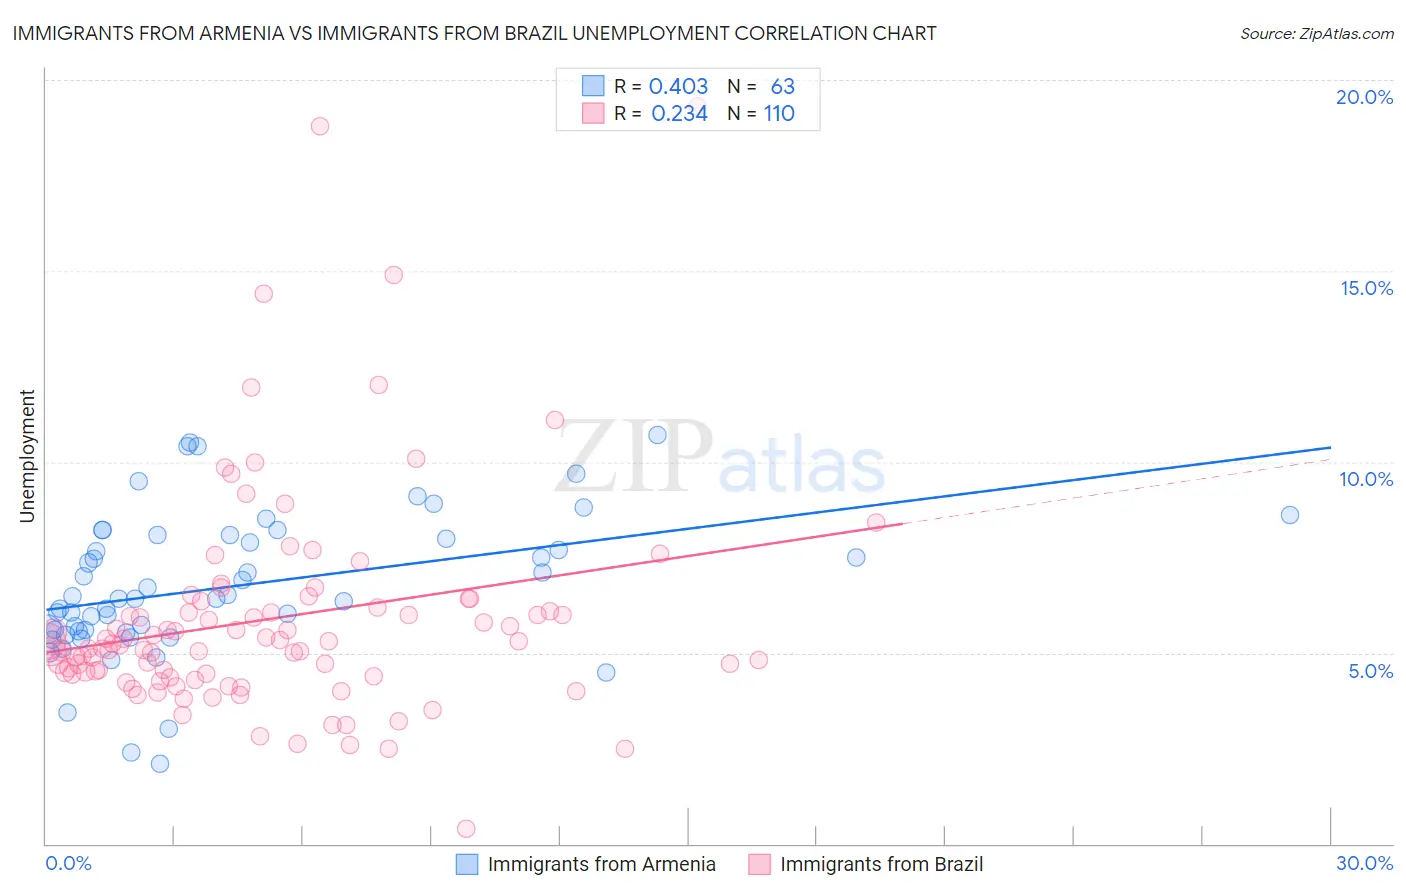
Immigrants from Armenia vs Immigrants from Brazil Unemployment Correlation Chart
The statistical analysis conducted on geographies consisting of 97,707,346 people shows a moderate positive correlation between the proportion of Immigrants from Armenia and unemployment in the United States with a correlation coefficient (R) of 0.403 and weighted average of 7.0%. Similarly, the statistical analysis conducted on geographies consisting of 342,796,240 people shows a weak positive correlation between the proportion of Immigrants from Brazil and unemployment in the United States with a correlation coefficient (R) of 0.234 and weighted average of 5.2%, a difference of 34.1%.
Unemployment Correlation Summary
| Measurement | Immigrants from Armenia | Immigrants from Brazil |
| Minimum | 2.1% | 0.40% |
| Maximum | 10.7% | 19.3% |
| Range | 8.6% | 18.9% |
| Mean | 6.7% | 5.9% |
| Median | 6.4% | 5.2% |
| Interquartile 25% (IQ1) | 5.6% | 4.5% |
| Interquartile 75% (IQ3) | 8.1% | 6.2% |
| Interquartile Range (IQR) | 2.5% | 1.7% |
| Standard Deviation (Sample) | 1.9% | 2.9% |
| Standard Deviation (Population) | 1.9% | 2.9% |
Similar Demographics by Unemployment
Demographics Similar to Immigrants from Armenia by Unemployment
In terms of unemployment, the demographic groups most similar to Immigrants from Armenia are Native/Alaskan (7.0%, a difference of 0.56%), Immigrants from Grenada (6.9%, a difference of 1.2%), Guyanese (6.9%, a difference of 1.5%), Immigrants from Guyana (6.9%, a difference of 1.5%), and Immigrants from St. Vincent and the Grenadines (6.9%, a difference of 1.5%).
| Demographics | Rating | Rank | Unemployment |
| Shoshone | 0.0 /100 | #317 | Tragic 6.8% |
| Immigrants | Cabo Verde | 0.0 /100 | #318 | Tragic 6.8% |
| British West Indians | 0.0 /100 | #319 | Tragic 6.8% |
| Immigrants | St. Vincent and the Grenadines | 0.0 /100 | #320 | Tragic 6.9% |
| Immigrants | Guyana | 0.0 /100 | #321 | Tragic 6.9% |
| Guyanese | 0.0 /100 | #322 | Tragic 6.9% |
| Immigrants | Grenada | 0.0 /100 | #323 | Tragic 6.9% |
| Immigrants | Armenia | 0.0 /100 | #324 | Tragic 7.0% |
| Natives/Alaskans | 0.0 /100 | #325 | Tragic 7.0% |
| Paiute | 0.0 /100 | #326 | Tragic 7.1% |
| Pueblo | 0.0 /100 | #327 | Tragic 7.2% |
| Tsimshian | 0.0 /100 | #328 | Tragic 7.2% |
| Alaska Natives | 0.0 /100 | #329 | Tragic 7.2% |
| Yakama | 0.0 /100 | #330 | Tragic 7.3% |
| Dominicans | 0.0 /100 | #331 | Tragic 7.4% |
Demographics Similar to Immigrants from Brazil by Unemployment
In terms of unemployment, the demographic groups most similar to Immigrants from Brazil are Immigrants from Zaire (5.2%, a difference of 0.11%), Immigrants from Colombia (5.2%, a difference of 0.11%), Spanish (5.2%, a difference of 0.13%), Immigrants from Indonesia (5.2%, a difference of 0.13%), and Colombian (5.2%, a difference of 0.13%).
| Demographics | Rating | Rank | Unemployment |
| Immigrants | Egypt | 66.7 /100 | #158 | Good 5.2% |
| Immigrants | Russia | 66.6 /100 | #159 | Good 5.2% |
| Laotians | 66.3 /100 | #160 | Good 5.2% |
| Immigrants | Oceania | 65.2 /100 | #161 | Good 5.2% |
| Spanish | 65.1 /100 | #162 | Good 5.2% |
| Immigrants | Zaire | 64.7 /100 | #163 | Good 5.2% |
| Immigrants | Colombia | 64.7 /100 | #164 | Good 5.2% |
| Immigrants | Brazil | 63.1 /100 | #165 | Good 5.2% |
| Immigrants | Indonesia | 61.2 /100 | #166 | Good 5.2% |
| Colombians | 61.1 /100 | #167 | Good 5.2% |
| Uruguayans | 60.2 /100 | #168 | Good 5.2% |
| Immigrants | Morocco | 59.1 /100 | #169 | Average 5.2% |
| Immigrants | Nicaragua | 57.1 /100 | #170 | Average 5.2% |
| Puget Sound Salish | 56.6 /100 | #171 | Average 5.2% |
| Immigrants | Vietnam | 52.5 /100 | #172 | Average 5.2% |