Immigrants from Central America vs Immigrants from Cuba Unemployment
COMPARE
Immigrants from Central America
Immigrants from Cuba
Unemployment
Unemployment Comparison
Immigrants from Central America
Immigrants from Cuba
6.0%
UNEMPLOYMENT
0.0/ 100
METRIC RATING
276th/ 347
METRIC RANK
4.6%
UNEMPLOYMENT
100.0/ 100
METRIC RATING
14th/ 347
METRIC RANK
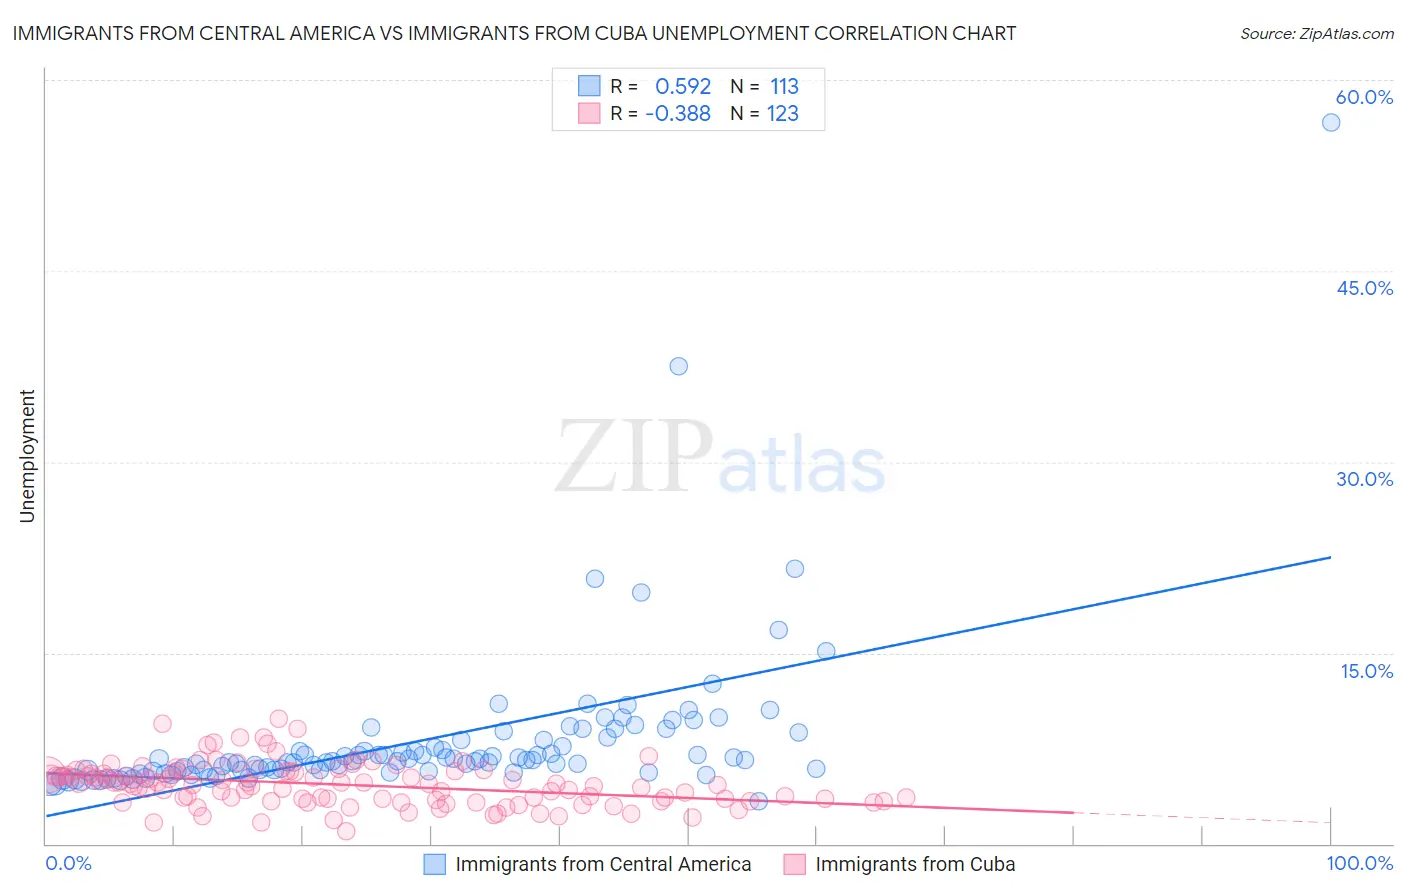
Immigrants from Central America vs Immigrants from Cuba Unemployment Correlation Chart
The statistical analysis conducted on geographies consisting of 534,368,587 people shows a substantial positive correlation between the proportion of Immigrants from Central America and unemployment in the United States with a correlation coefficient (R) of 0.592 and weighted average of 6.0%. Similarly, the statistical analysis conducted on geographies consisting of 325,813,877 people shows a mild negative correlation between the proportion of Immigrants from Cuba and unemployment in the United States with a correlation coefficient (R) of -0.388 and weighted average of 4.6%, a difference of 28.8%.
Unemployment Correlation Summary
| Measurement | Immigrants from Central America | Immigrants from Cuba |
| Minimum | 3.3% | 1.0% |
| Maximum | 56.6% | 9.8% |
| Range | 53.3% | 8.8% |
| Mean | 8.1% | 4.6% |
| Median | 6.5% | 4.7% |
| Interquartile 25% (IQ1) | 5.7% | 3.4% |
| Interquartile 75% (IQ3) | 8.1% | 5.6% |
| Interquartile Range (IQR) | 2.4% | 2.2% |
| Standard Deviation (Sample) | 6.2% | 1.7% |
| Standard Deviation (Population) | 6.2% | 1.7% |
Similar Demographics by Unemployment
Demographics Similar to Immigrants from Central America by Unemployment
In terms of unemployment, the demographic groups most similar to Immigrants from Central America are Immigrants from Latin America (5.9%, a difference of 0.28%), Armenian (6.0%, a difference of 0.35%), Bahamian (5.9%, a difference of 0.49%), Ghanaian (6.0%, a difference of 0.64%), and Immigrants from Fiji (5.9%, a difference of 0.78%).
| Demographics | Rating | Rank | Unemployment |
| Immigrants | El Salvador | 0.1 /100 | #269 | Tragic 5.8% |
| Blackfeet | 0.1 /100 | #270 | Tragic 5.8% |
| Mexicans | 0.1 /100 | #271 | Tragic 5.9% |
| Hispanics or Latinos | 0.0 /100 | #272 | Tragic 5.9% |
| Immigrants | Fiji | 0.0 /100 | #273 | Tragic 5.9% |
| Bahamians | 0.0 /100 | #274 | Tragic 5.9% |
| Immigrants | Latin America | 0.0 /100 | #275 | Tragic 5.9% |
| Immigrants | Central America | 0.0 /100 | #276 | Tragic 6.0% |
| Armenians | 0.0 /100 | #277 | Tragic 6.0% |
| Ghanaians | 0.0 /100 | #278 | Tragic 6.0% |
| Immigrants | Mexico | 0.0 /100 | #279 | Tragic 6.0% |
| Immigrants | Western Africa | 0.0 /100 | #280 | Tragic 6.0% |
| Africans | 0.0 /100 | #281 | Tragic 6.1% |
| Immigrants | Azores | 0.0 /100 | #282 | Tragic 6.1% |
| Immigrants | Ghana | 0.0 /100 | #283 | Tragic 6.1% |
Demographics Similar to Immigrants from Cuba by Unemployment
In terms of unemployment, the demographic groups most similar to Immigrants from Cuba are Belgian (4.6%, a difference of 0.24%), Pennsylvania German (4.6%, a difference of 0.40%), European (4.6%, a difference of 0.48%), English (4.6%, a difference of 0.50%), and Chinese (4.7%, a difference of 0.62%).
| Demographics | Rating | Rank | Unemployment |
| Immigrants | India | 100.0 /100 | #7 | Exceptional 4.5% |
| Swiss | 100.0 /100 | #8 | Exceptional 4.5% |
| Scandinavians | 100.0 /100 | #9 | Exceptional 4.5% |
| Dutch | 100.0 /100 | #10 | Exceptional 4.6% |
| English | 100.0 /100 | #11 | Exceptional 4.6% |
| Pennsylvania Germans | 100.0 /100 | #12 | Exceptional 4.6% |
| Belgians | 100.0 /100 | #13 | Exceptional 4.6% |
| Immigrants | Cuba | 100.0 /100 | #14 | Exceptional 4.6% |
| Europeans | 99.9 /100 | #15 | Exceptional 4.6% |
| Chinese | 99.9 /100 | #16 | Exceptional 4.7% |
| Slovenes | 99.9 /100 | #17 | Exceptional 4.7% |
| Immigrants | Venezuela | 99.9 /100 | #18 | Exceptional 4.7% |
| Scottish | 99.9 /100 | #19 | Exceptional 4.7% |
| Carpatho Rusyns | 99.9 /100 | #20 | Exceptional 4.7% |
| Welsh | 99.9 /100 | #21 | Exceptional 4.7% |