Immigrants from Armenia vs Immigrants from Saudi Arabia Unemployment
COMPARE
Immigrants from Armenia
Immigrants from Saudi Arabia
Unemployment
Unemployment Comparison
Immigrants from Armenia
Immigrants from Saudi Arabia
7.0%
UNEMPLOYMENT
0.0/ 100
METRIC RATING
324th/ 347
METRIC RANK
5.1%
UNEMPLOYMENT
85.6/ 100
METRIC RATING
137th/ 347
METRIC RANK
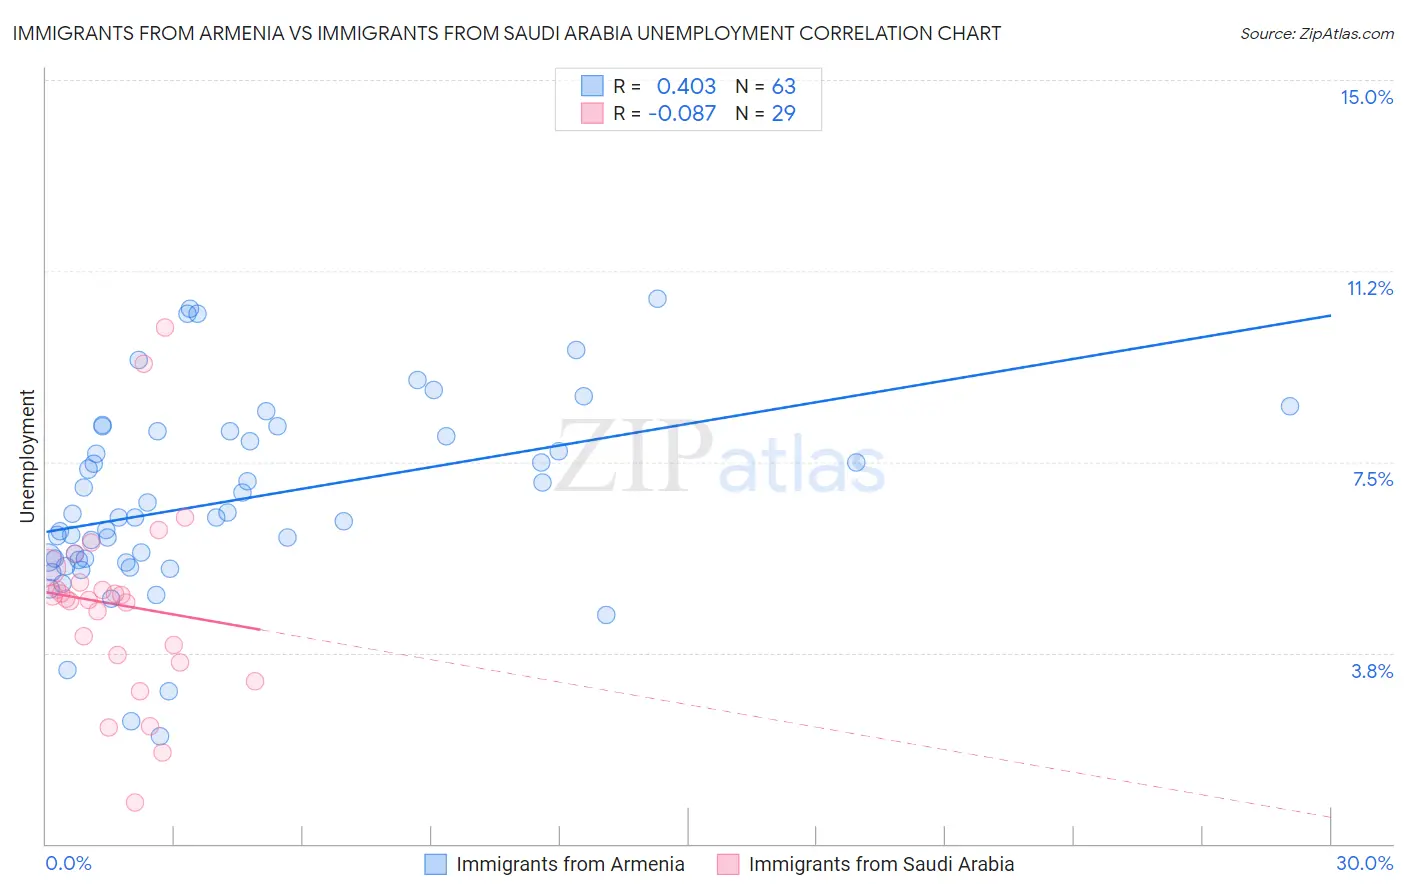
Immigrants from Armenia vs Immigrants from Saudi Arabia Unemployment Correlation Chart
The statistical analysis conducted on geographies consisting of 97,707,346 people shows a moderate positive correlation between the proportion of Immigrants from Armenia and unemployment in the United States with a correlation coefficient (R) of 0.403 and weighted average of 7.0%. Similarly, the statistical analysis conducted on geographies consisting of 164,272,517 people shows a slight negative correlation between the proportion of Immigrants from Saudi Arabia and unemployment in the United States with a correlation coefficient (R) of -0.087 and weighted average of 5.1%, a difference of 36.8%.
Unemployment Correlation Summary
| Measurement | Immigrants from Armenia | Immigrants from Saudi Arabia |
| Minimum | 2.1% | 0.80% |
| Maximum | 10.7% | 10.1% |
| Range | 8.6% | 9.3% |
| Mean | 6.7% | 4.7% |
| Median | 6.4% | 4.8% |
| Interquartile 25% (IQ1) | 5.6% | 3.6% |
| Interquartile 75% (IQ3) | 8.1% | 5.3% |
| Interquartile Range (IQR) | 2.5% | 1.6% |
| Standard Deviation (Sample) | 1.9% | 1.9% |
| Standard Deviation (Population) | 1.9% | 1.9% |
Similar Demographics by Unemployment
Demographics Similar to Immigrants from Armenia by Unemployment
In terms of unemployment, the demographic groups most similar to Immigrants from Armenia are Native/Alaskan (7.0%, a difference of 0.56%), Immigrants from Grenada (6.9%, a difference of 1.2%), Guyanese (6.9%, a difference of 1.5%), Immigrants from Guyana (6.9%, a difference of 1.5%), and Immigrants from St. Vincent and the Grenadines (6.9%, a difference of 1.5%).
| Demographics | Rating | Rank | Unemployment |
| Shoshone | 0.0 /100 | #317 | Tragic 6.8% |
| Immigrants | Cabo Verde | 0.0 /100 | #318 | Tragic 6.8% |
| British West Indians | 0.0 /100 | #319 | Tragic 6.8% |
| Immigrants | St. Vincent and the Grenadines | 0.0 /100 | #320 | Tragic 6.9% |
| Immigrants | Guyana | 0.0 /100 | #321 | Tragic 6.9% |
| Guyanese | 0.0 /100 | #322 | Tragic 6.9% |
| Immigrants | Grenada | 0.0 /100 | #323 | Tragic 6.9% |
| Immigrants | Armenia | 0.0 /100 | #324 | Tragic 7.0% |
| Natives/Alaskans | 0.0 /100 | #325 | Tragic 7.0% |
| Paiute | 0.0 /100 | #326 | Tragic 7.1% |
| Pueblo | 0.0 /100 | #327 | Tragic 7.2% |
| Tsimshian | 0.0 /100 | #328 | Tragic 7.2% |
| Alaska Natives | 0.0 /100 | #329 | Tragic 7.2% |
| Yakama | 0.0 /100 | #330 | Tragic 7.3% |
| Dominicans | 0.0 /100 | #331 | Tragic 7.4% |
Demographics Similar to Immigrants from Saudi Arabia by Unemployment
In terms of unemployment, the demographic groups most similar to Immigrants from Saudi Arabia are Immigrants from Hungary (5.1%, a difference of 0.010%), Pakistani (5.1%, a difference of 0.040%), Immigrants from Spain (5.1%, a difference of 0.070%), Immigrants from Burma/Myanmar (5.1%, a difference of 0.080%), and Immigrants from Europe (5.1%, a difference of 0.090%).
| Demographics | Rating | Rank | Unemployment |
| Iranians | 86.9 /100 | #130 | Excellent 5.1% |
| Immigrants | Croatia | 86.8 /100 | #131 | Excellent 5.1% |
| Immigrants | Ethiopia | 86.7 /100 | #132 | Excellent 5.1% |
| Immigrants | Jordan | 86.6 /100 | #133 | Excellent 5.1% |
| Immigrants | Europe | 86.3 /100 | #134 | Excellent 5.1% |
| Immigrants | Burma/Myanmar | 86.2 /100 | #135 | Excellent 5.1% |
| Immigrants | Spain | 86.2 /100 | #136 | Excellent 5.1% |
| Immigrants | Saudi Arabia | 85.6 /100 | #137 | Excellent 5.1% |
| Immigrants | Hungary | 85.6 /100 | #138 | Excellent 5.1% |
| Pakistanis | 85.3 /100 | #139 | Excellent 5.1% |
| Immigrants | Denmark | 84.3 /100 | #140 | Excellent 5.1% |
| Palestinians | 83.4 /100 | #141 | Excellent 5.1% |
| Immigrants | Pakistan | 83.2 /100 | #142 | Excellent 5.1% |
| Immigrants | Chile | 82.8 /100 | #143 | Excellent 5.1% |
| Indonesians | 82.3 /100 | #144 | Excellent 5.1% |