Immigrants from Armenia vs Immigrants from Africa Unemployment
COMPARE
Immigrants from Armenia
Immigrants from Africa
Unemployment
Unemployment Comparison
Immigrants from Armenia
Immigrants from Africa
7.0%
UNEMPLOYMENT
0.0/ 100
METRIC RATING
324th/ 347
METRIC RANK
5.5%
UNEMPLOYMENT
4.9/ 100
METRIC RATING
231st/ 347
METRIC RANK
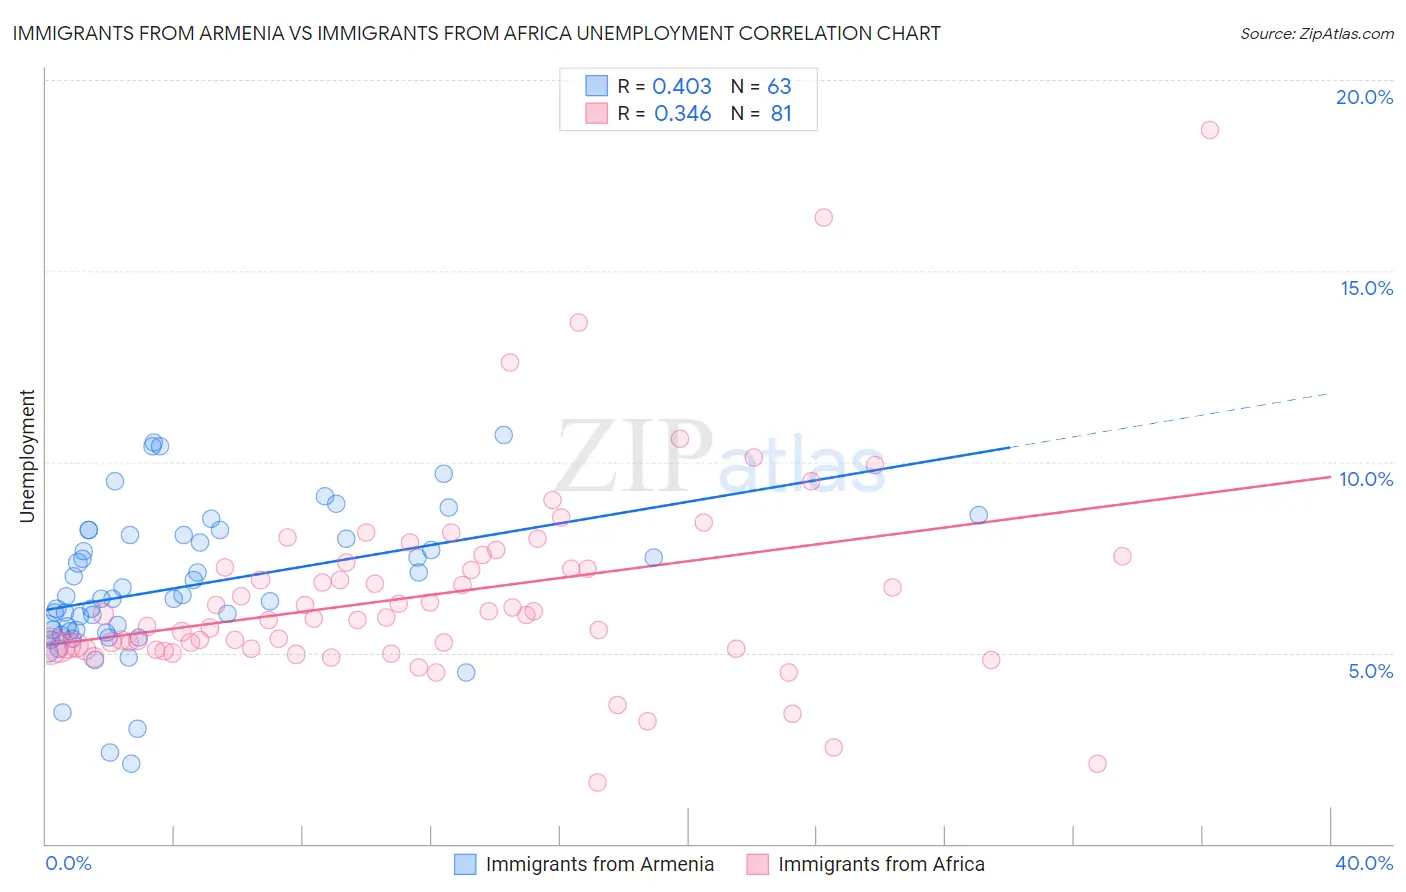
Immigrants from Armenia vs Immigrants from Africa Unemployment Correlation Chart
The statistical analysis conducted on geographies consisting of 97,707,346 people shows a moderate positive correlation between the proportion of Immigrants from Armenia and unemployment in the United States with a correlation coefficient (R) of 0.403 and weighted average of 7.0%. Similarly, the statistical analysis conducted on geographies consisting of 468,788,801 people shows a mild positive correlation between the proportion of Immigrants from Africa and unemployment in the United States with a correlation coefficient (R) of 0.346 and weighted average of 5.5%, a difference of 27.3%.
Unemployment Correlation Summary
| Measurement | Immigrants from Armenia | Immigrants from Africa |
| Minimum | 2.1% | 1.6% |
| Maximum | 10.7% | 18.7% |
| Range | 8.6% | 17.1% |
| Mean | 6.7% | 6.5% |
| Median | 6.4% | 5.9% |
| Interquartile 25% (IQ1) | 5.6% | 5.1% |
| Interquartile 75% (IQ3) | 8.1% | 7.3% |
| Interquartile Range (IQR) | 2.5% | 2.2% |
| Standard Deviation (Sample) | 1.9% | 2.7% |
| Standard Deviation (Population) | 1.9% | 2.6% |
Similar Demographics by Unemployment
Demographics Similar to Immigrants from Armenia by Unemployment
In terms of unemployment, the demographic groups most similar to Immigrants from Armenia are Native/Alaskan (7.0%, a difference of 0.56%), Immigrants from Grenada (6.9%, a difference of 1.2%), Guyanese (6.9%, a difference of 1.5%), Immigrants from Guyana (6.9%, a difference of 1.5%), and Immigrants from St. Vincent and the Grenadines (6.9%, a difference of 1.5%).
| Demographics | Rating | Rank | Unemployment |
| Shoshone | 0.0 /100 | #317 | Tragic 6.8% |
| Immigrants | Cabo Verde | 0.0 /100 | #318 | Tragic 6.8% |
| British West Indians | 0.0 /100 | #319 | Tragic 6.8% |
| Immigrants | St. Vincent and the Grenadines | 0.0 /100 | #320 | Tragic 6.9% |
| Immigrants | Guyana | 0.0 /100 | #321 | Tragic 6.9% |
| Guyanese | 0.0 /100 | #322 | Tragic 6.9% |
| Immigrants | Grenada | 0.0 /100 | #323 | Tragic 6.9% |
| Immigrants | Armenia | 0.0 /100 | #324 | Tragic 7.0% |
| Natives/Alaskans | 0.0 /100 | #325 | Tragic 7.0% |
| Paiute | 0.0 /100 | #326 | Tragic 7.1% |
| Pueblo | 0.0 /100 | #327 | Tragic 7.2% |
| Tsimshian | 0.0 /100 | #328 | Tragic 7.2% |
| Alaska Natives | 0.0 /100 | #329 | Tragic 7.2% |
| Yakama | 0.0 /100 | #330 | Tragic 7.3% |
| Dominicans | 0.0 /100 | #331 | Tragic 7.4% |
Demographics Similar to Immigrants from Africa by Unemployment
In terms of unemployment, the demographic groups most similar to Immigrants from Africa are Comanche (5.5%, a difference of 0.0%), Immigrants from Syria (5.5%, a difference of 0.050%), Panamanian (5.5%, a difference of 0.080%), Hawaiian (5.5%, a difference of 0.13%), and Ottawa (5.5%, a difference of 0.13%).
| Demographics | Rating | Rank | Unemployment |
| Israelis | 8.8 /100 | #224 | Tragic 5.4% |
| South American Indians | 7.8 /100 | #225 | Tragic 5.5% |
| Samoans | 7.1 /100 | #226 | Tragic 5.5% |
| Immigrants | Lebanon | 7.0 /100 | #227 | Tragic 5.5% |
| Guamanians/Chamorros | 6.3 /100 | #228 | Tragic 5.5% |
| Hawaiians | 5.4 /100 | #229 | Tragic 5.5% |
| Ottawa | 5.4 /100 | #230 | Tragic 5.5% |
| Immigrants | Africa | 4.9 /100 | #231 | Tragic 5.5% |
| Comanche | 4.9 /100 | #232 | Tragic 5.5% |
| Immigrants | Syria | 4.8 /100 | #233 | Tragic 5.5% |
| Panamanians | 4.7 /100 | #234 | Tragic 5.5% |
| Immigrants | Panama | 3.4 /100 | #235 | Tragic 5.5% |
| Immigrants | Cambodia | 3.3 /100 | #236 | Tragic 5.5% |
| Moroccans | 3.2 /100 | #237 | Tragic 5.5% |
| Immigrants | Western Asia | 2.8 /100 | #238 | Tragic 5.5% |