Greek vs Immigrants from Cuba Unemployment
COMPARE
Greek
Immigrants from Cuba
Unemployment
Unemployment Comparison
Greeks
Immigrants from Cuba
4.9%
UNEMPLOYMENT
99.0/ 100
METRIC RATING
58th/ 347
METRIC RANK
4.6%
UNEMPLOYMENT
100.0/ 100
METRIC RATING
14th/ 347
METRIC RANK
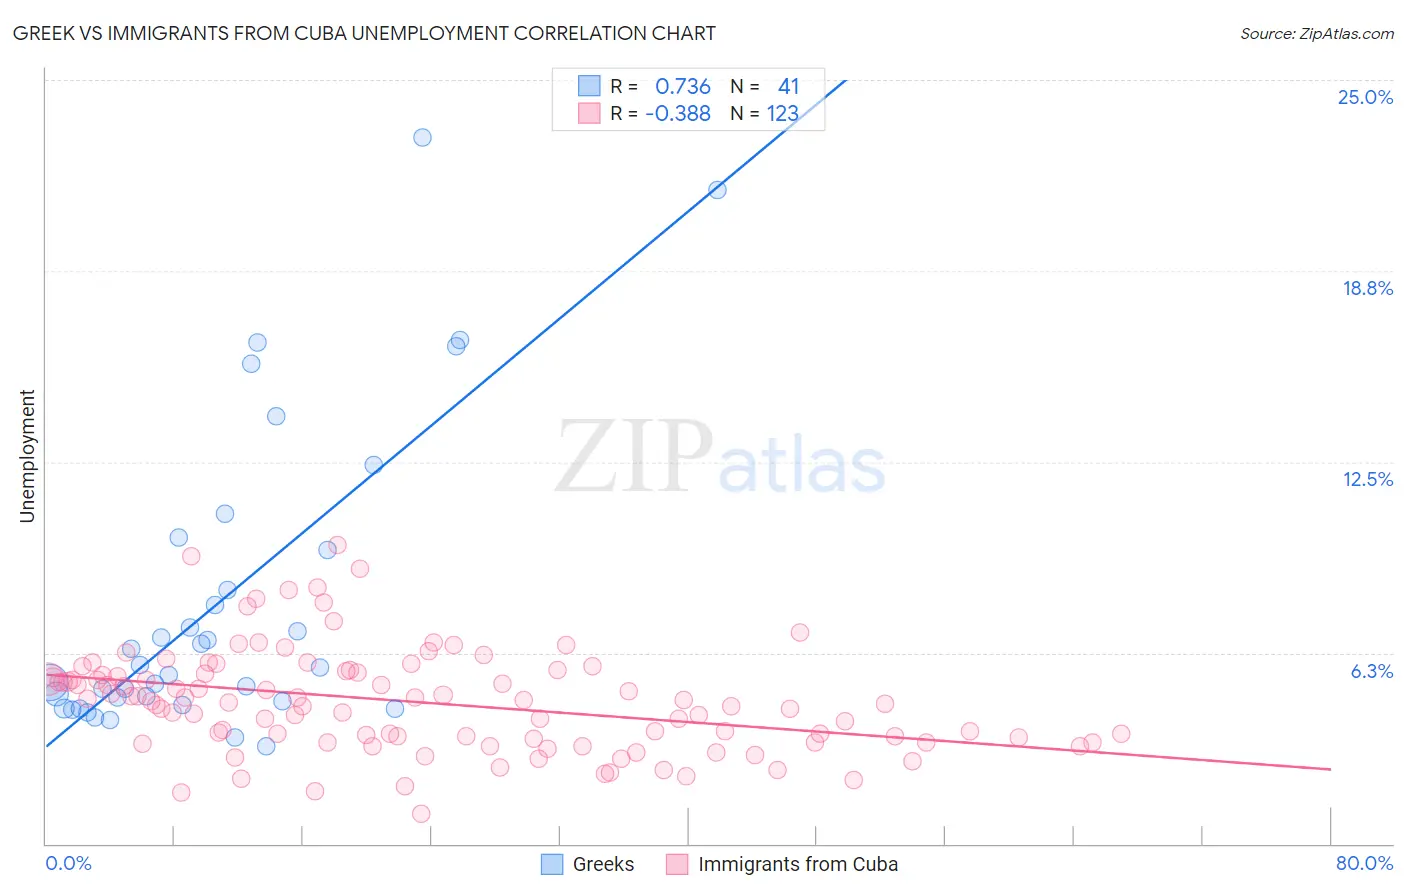
Greek vs Immigrants from Cuba Unemployment Correlation Chart
The statistical analysis conducted on geographies consisting of 481,787,990 people shows a strong positive correlation between the proportion of Greeks and unemployment in the United States with a correlation coefficient (R) of 0.736 and weighted average of 4.9%. Similarly, the statistical analysis conducted on geographies consisting of 325,813,877 people shows a mild negative correlation between the proportion of Immigrants from Cuba and unemployment in the United States with a correlation coefficient (R) of -0.388 and weighted average of 4.6%, a difference of 5.7%.
Unemployment Correlation Summary
| Measurement | Greek | Immigrants from Cuba |
| Minimum | 3.2% | 1.0% |
| Maximum | 23.1% | 9.8% |
| Range | 19.9% | 8.8% |
| Mean | 8.0% | 4.6% |
| Median | 5.8% | 4.7% |
| Interquartile 25% (IQ1) | 4.6% | 3.4% |
| Interquartile 75% (IQ3) | 9.8% | 5.6% |
| Interquartile Range (IQR) | 5.2% | 2.2% |
| Standard Deviation (Sample) | 5.0% | 1.7% |
| Standard Deviation (Population) | 5.0% | 1.7% |
Similar Demographics by Unemployment
Demographics Similar to Greeks by Unemployment
In terms of unemployment, the demographic groups most similar to Greeks are Bhutanese (4.9%, a difference of 0.030%), Immigrants from Netherlands (4.9%, a difference of 0.070%), Cambodian (4.9%, a difference of 0.070%), Icelander (4.9%, a difference of 0.080%), and Immigrants from Singapore (4.9%, a difference of 0.10%).
| Demographics | Rating | Rank | Unemployment |
| Immigrants | Belgium | 99.2 /100 | #51 | Exceptional 4.9% |
| Whites/Caucasians | 99.2 /100 | #52 | Exceptional 4.9% |
| Immigrants | Zimbabwe | 99.2 /100 | #53 | Exceptional 4.9% |
| Eastern Europeans | 99.2 /100 | #54 | Exceptional 4.9% |
| Australians | 99.2 /100 | #55 | Exceptional 4.9% |
| Celtics | 99.1 /100 | #56 | Exceptional 4.9% |
| Immigrants | Singapore | 99.1 /100 | #57 | Exceptional 4.9% |
| Greeks | 99.0 /100 | #58 | Exceptional 4.9% |
| Bhutanese | 99.0 /100 | #59 | Exceptional 4.9% |
| Immigrants | Netherlands | 99.0 /100 | #60 | Exceptional 4.9% |
| Cambodians | 99.0 /100 | #61 | Exceptional 4.9% |
| Icelanders | 98.9 /100 | #62 | Exceptional 4.9% |
| Immigrants | Bulgaria | 98.9 /100 | #63 | Exceptional 4.9% |
| Italians | 98.9 /100 | #64 | Exceptional 4.9% |
| Immigrants | Canada | 98.8 /100 | #65 | Exceptional 4.9% |
Demographics Similar to Immigrants from Cuba by Unemployment
In terms of unemployment, the demographic groups most similar to Immigrants from Cuba are Belgian (4.6%, a difference of 0.24%), Pennsylvania German (4.6%, a difference of 0.40%), European (4.6%, a difference of 0.48%), English (4.6%, a difference of 0.50%), and Chinese (4.7%, a difference of 0.62%).
| Demographics | Rating | Rank | Unemployment |
| Immigrants | India | 100.0 /100 | #7 | Exceptional 4.5% |
| Swiss | 100.0 /100 | #8 | Exceptional 4.5% |
| Scandinavians | 100.0 /100 | #9 | Exceptional 4.5% |
| Dutch | 100.0 /100 | #10 | Exceptional 4.6% |
| English | 100.0 /100 | #11 | Exceptional 4.6% |
| Pennsylvania Germans | 100.0 /100 | #12 | Exceptional 4.6% |
| Belgians | 100.0 /100 | #13 | Exceptional 4.6% |
| Immigrants | Cuba | 100.0 /100 | #14 | Exceptional 4.6% |
| Europeans | 99.9 /100 | #15 | Exceptional 4.6% |
| Chinese | 99.9 /100 | #16 | Exceptional 4.7% |
| Slovenes | 99.9 /100 | #17 | Exceptional 4.7% |
| Immigrants | Venezuela | 99.9 /100 | #18 | Exceptional 4.7% |
| Scottish | 99.9 /100 | #19 | Exceptional 4.7% |
| Carpatho Rusyns | 99.9 /100 | #20 | Exceptional 4.7% |
| Welsh | 99.9 /100 | #21 | Exceptional 4.7% |