Immigrants from Armenia vs Immigrants from Jamaica Unemployment
COMPARE
Immigrants from Armenia
Immigrants from Jamaica
Unemployment
Unemployment Comparison
Immigrants from Armenia
Immigrants from Jamaica
7.0%
UNEMPLOYMENT
0.0/ 100
METRIC RATING
324th/ 347
METRIC RANK
6.4%
UNEMPLOYMENT
0.0/ 100
METRIC RATING
304th/ 347
METRIC RANK
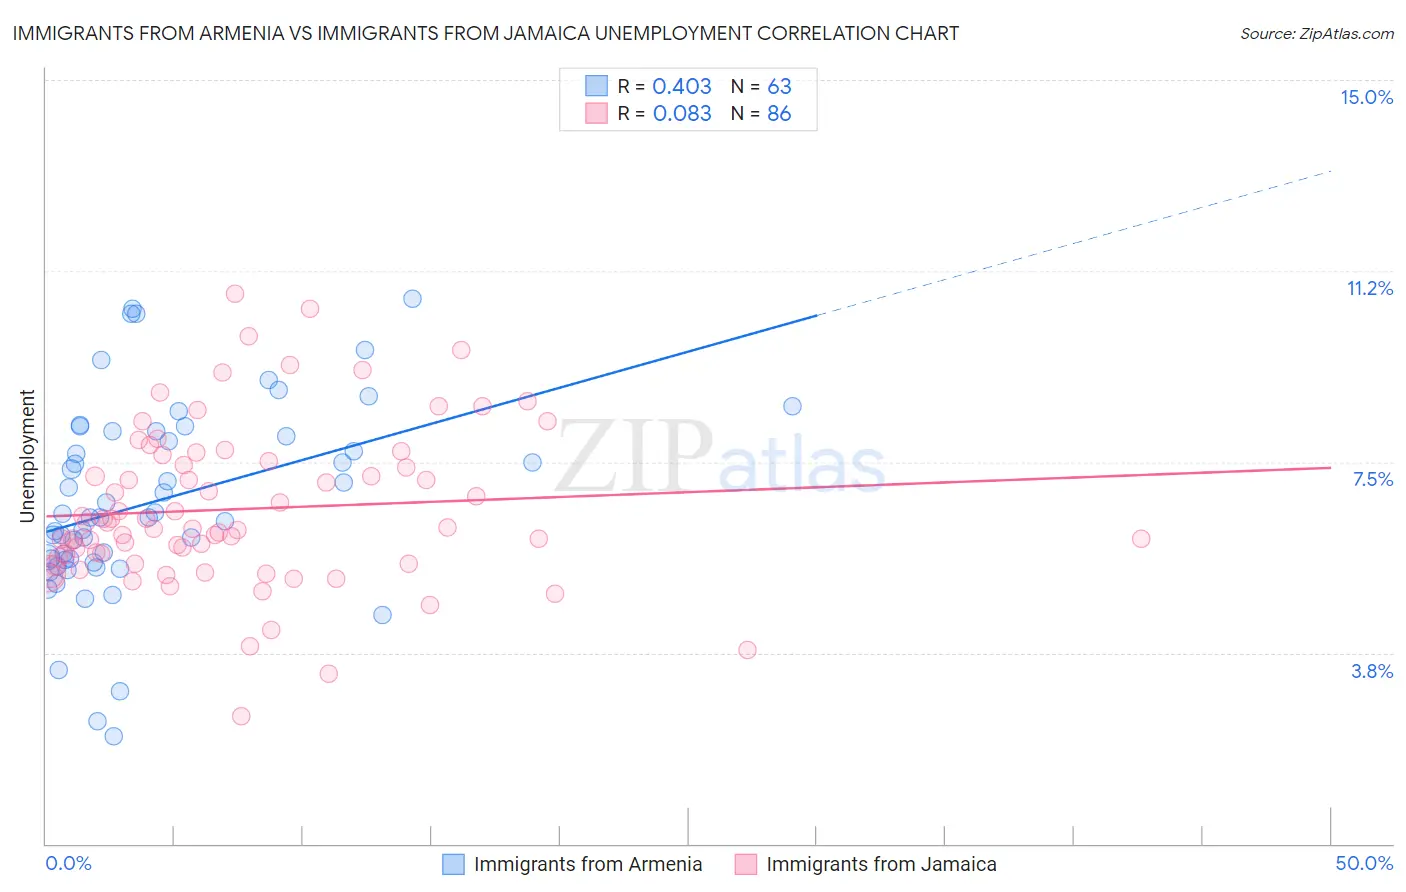
Immigrants from Armenia vs Immigrants from Jamaica Unemployment Correlation Chart
The statistical analysis conducted on geographies consisting of 97,707,346 people shows a moderate positive correlation between the proportion of Immigrants from Armenia and unemployment in the United States with a correlation coefficient (R) of 0.403 and weighted average of 7.0%. Similarly, the statistical analysis conducted on geographies consisting of 301,587,568 people shows a slight positive correlation between the proportion of Immigrants from Jamaica and unemployment in the United States with a correlation coefficient (R) of 0.083 and weighted average of 6.4%, a difference of 8.9%.
Unemployment Correlation Summary
| Measurement | Immigrants from Armenia | Immigrants from Jamaica |
| Minimum | 2.1% | 2.5% |
| Maximum | 10.7% | 10.8% |
| Range | 8.6% | 8.3% |
| Mean | 6.7% | 6.6% |
| Median | 6.4% | 6.2% |
| Interquartile 25% (IQ1) | 5.6% | 5.6% |
| Interquartile 75% (IQ3) | 8.1% | 7.5% |
| Interquartile Range (IQR) | 2.5% | 1.9% |
| Standard Deviation (Sample) | 1.9% | 1.6% |
| Standard Deviation (Population) | 1.9% | 1.6% |
Demographics Similar to Immigrants from Armenia and Immigrants from Jamaica by Unemployment
In terms of unemployment, the demographic groups most similar to Immigrants from Armenia are Immigrants from Grenada (6.9%, a difference of 1.2%), Guyanese (6.9%, a difference of 1.5%), Immigrants from Guyana (6.9%, a difference of 1.5%), Immigrants from St. Vincent and the Grenadines (6.9%, a difference of 1.5%), and British West Indian (6.8%, a difference of 2.3%). Similarly, the demographic groups most similar to Immigrants from Jamaica are Menominee (6.4%, a difference of 0.25%), Lumbee (6.4%, a difference of 0.29%), Immigrants from Bangladesh (6.5%, a difference of 0.77%), Barbadian (6.5%, a difference of 1.1%), and Vietnamese (6.5%, a difference of 1.2%).
| Demographics | Rating | Rank | Unemployment |
| Immigrants | Jamaica | 0.0 /100 | #304 | Tragic 6.4% |
| Menominee | 0.0 /100 | #305 | Tragic 6.4% |
| Lumbee | 0.0 /100 | #306 | Tragic 6.4% |
| Immigrants | Bangladesh | 0.0 /100 | #307 | Tragic 6.5% |
| Barbadians | 0.0 /100 | #308 | Tragic 6.5% |
| Vietnamese | 0.0 /100 | #309 | Tragic 6.5% |
| Immigrants | Belize | 0.0 /100 | #310 | Tragic 6.5% |
| Cape Verdeans | 0.0 /100 | #311 | Tragic 6.5% |
| Colville | 0.0 /100 | #312 | Tragic 6.6% |
| Immigrants | Barbados | 0.0 /100 | #313 | Tragic 6.6% |
| Blacks/African Americans | 0.0 /100 | #314 | Tragic 6.6% |
| Houma | 0.0 /100 | #315 | Tragic 6.7% |
| Immigrants | Dominica | 0.0 /100 | #316 | Tragic 6.7% |
| Shoshone | 0.0 /100 | #317 | Tragic 6.8% |
| Immigrants | Cabo Verde | 0.0 /100 | #318 | Tragic 6.8% |
| British West Indians | 0.0 /100 | #319 | Tragic 6.8% |
| Immigrants | St. Vincent and the Grenadines | 0.0 /100 | #320 | Tragic 6.9% |
| Immigrants | Guyana | 0.0 /100 | #321 | Tragic 6.9% |
| Guyanese | 0.0 /100 | #322 | Tragic 6.9% |
| Immigrants | Grenada | 0.0 /100 | #323 | Tragic 6.9% |
| Immigrants | Armenia | 0.0 /100 | #324 | Tragic 7.0% |