Dominican vs Immigrants from Micronesia Female Unemployment
COMPARE
Dominican
Immigrants from Micronesia
Female Unemployment
Female Unemployment Comparison
Dominicans
Immigrants from Micronesia
7.2%
FEMALE UNEMPLOYMENT
0.0/ 100
METRIC RATING
335th/ 347
METRIC RANK
5.2%
FEMALE UNEMPLOYMENT
66.9/ 100
METRIC RATING
159th/ 347
METRIC RANK
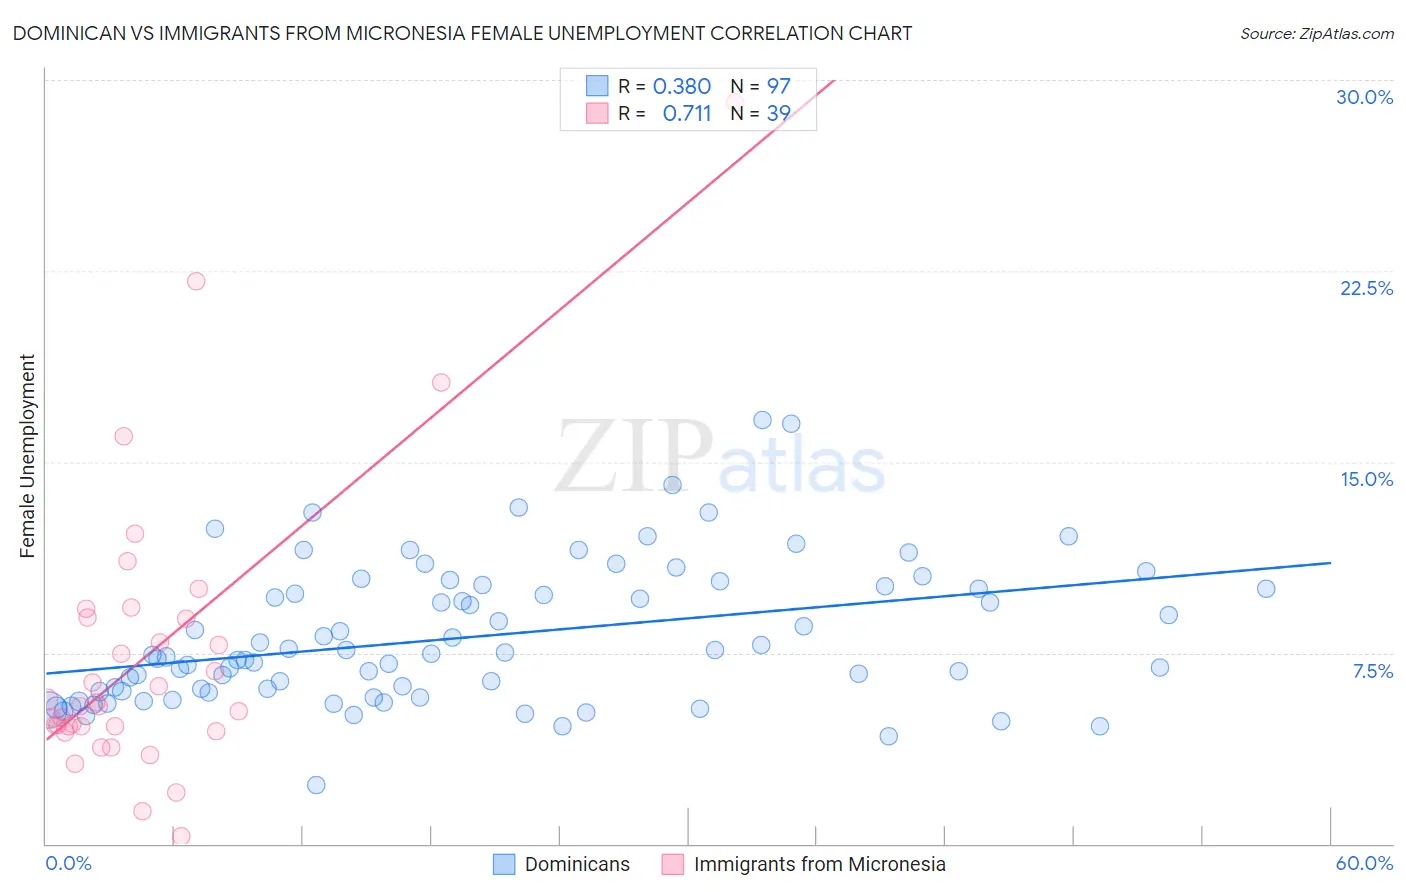
Dominican vs Immigrants from Micronesia Female Unemployment Correlation Chart
The statistical analysis conducted on geographies consisting of 353,758,930 people shows a mild positive correlation between the proportion of Dominicans and unemploymnet rate among females in the United States with a correlation coefficient (R) of 0.380 and weighted average of 7.2%. Similarly, the statistical analysis conducted on geographies consisting of 61,521,067 people shows a strong positive correlation between the proportion of Immigrants from Micronesia and unemploymnet rate among females in the United States with a correlation coefficient (R) of 0.711 and weighted average of 5.2%, a difference of 37.9%.
Female Unemployment Correlation Summary
| Measurement | Dominican | Immigrants from Micronesia |
| Minimum | 2.3% | 0.30% |
| Maximum | 16.7% | 29.1% |
| Range | 14.4% | 28.8% |
| Mean | 8.1% | 7.4% |
| Median | 7.4% | 5.4% |
| Interquartile 25% (IQ1) | 6.0% | 4.6% |
| Interquartile 75% (IQ3) | 10.1% | 8.9% |
| Interquartile Range (IQR) | 4.1% | 4.3% |
| Standard Deviation (Sample) | 2.8% | 5.6% |
| Standard Deviation (Population) | 2.7% | 5.6% |
Similar Demographics by Female Unemployment
Demographics Similar to Dominicans by Female Unemployment
In terms of female unemployment, the demographic groups most similar to Dominicans are Immigrants from Dominican Republic (7.2%, a difference of 0.64%), Immigrants from Armenia (7.1%, a difference of 1.4%), Navajo (7.3%, a difference of 1.6%), Menominee (7.0%, a difference of 1.8%), and Sioux (7.0%, a difference of 1.8%).
| Demographics | Rating | Rank | Female Unemployment |
| Guyanese | 0.0 /100 | #328 | Tragic 6.7% |
| Immigrants | Guyana | 0.0 /100 | #329 | Tragic 6.7% |
| Yakama | 0.0 /100 | #330 | Tragic 6.7% |
| Paiute | 0.0 /100 | #331 | Tragic 6.8% |
| Sioux | 0.0 /100 | #332 | Tragic 7.0% |
| Menominee | 0.0 /100 | #333 | Tragic 7.0% |
| Immigrants | Armenia | 0.0 /100 | #334 | Tragic 7.1% |
| Dominicans | 0.0 /100 | #335 | Tragic 7.2% |
| Immigrants | Dominican Republic | 0.0 /100 | #336 | Tragic 7.2% |
| Navajo | 0.0 /100 | #337 | Tragic 7.3% |
| Tohono O'odham | 0.0 /100 | #338 | Tragic 7.7% |
| Immigrants | Yemen | 0.0 /100 | #339 | Tragic 7.8% |
| Hopi | 0.0 /100 | #340 | Tragic 8.1% |
| Inupiat | 0.0 /100 | #341 | Tragic 8.2% |
| Puerto Ricans | 0.0 /100 | #342 | Tragic 8.3% |
Demographics Similar to Immigrants from Micronesia by Female Unemployment
In terms of female unemployment, the demographic groups most similar to Immigrants from Micronesia are Immigrants from Spain (5.2%, a difference of 0.010%), Immigrants from Pakistan (5.2%, a difference of 0.010%), Potawatomi (5.2%, a difference of 0.070%), Albanian (5.2%, a difference of 0.10%), and Immigrants from Russia (5.2%, a difference of 0.17%).
| Demographics | Rating | Rank | Female Unemployment |
| Immigrants | Italy | 75.0 /100 | #152 | Good 5.2% |
| Immigrants | Greece | 74.9 /100 | #153 | Good 5.2% |
| South Africans | 70.8 /100 | #154 | Good 5.2% |
| Immigrants | Egypt | 70.0 /100 | #155 | Good 5.2% |
| Immigrants | Northern Africa | 69.6 /100 | #156 | Good 5.2% |
| Immigrants | Russia | 69.3 /100 | #157 | Good 5.2% |
| Albanians | 68.3 /100 | #158 | Good 5.2% |
| Immigrants | Micronesia | 66.9 /100 | #159 | Good 5.2% |
| Immigrants | Spain | 66.8 /100 | #160 | Good 5.2% |
| Immigrants | Pakistan | 66.7 /100 | #161 | Good 5.2% |
| Potawatomi | 65.9 /100 | #162 | Good 5.2% |
| Immigrants | Asia | 64.3 /100 | #163 | Good 5.2% |
| Bangladeshis | 64.3 /100 | #164 | Good 5.2% |
| Syrians | 62.8 /100 | #165 | Good 5.2% |
| Native Hawaiians | 62.7 /100 | #166 | Good 5.2% |