Dominican vs Blackfeet Female Unemployment
COMPARE
Dominican
Blackfeet
Female Unemployment
Female Unemployment Comparison
Dominicans
Blackfeet
7.2%
FEMALE UNEMPLOYMENT
0.0/ 100
METRIC RATING
335th/ 347
METRIC RANK
5.9%
FEMALE UNEMPLOYMENT
0.0/ 100
METRIC RATING
265th/ 347
METRIC RANK
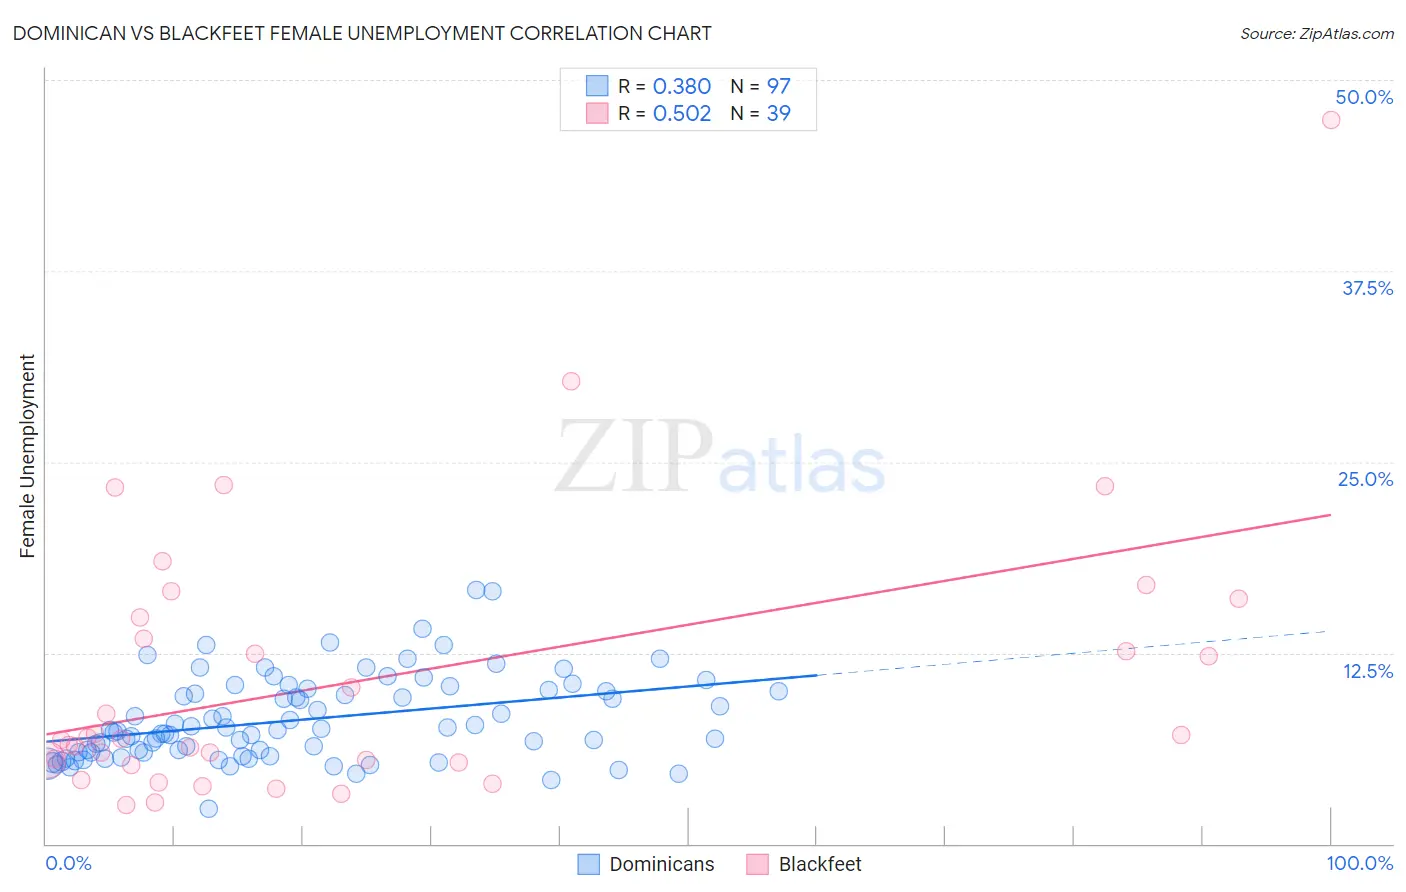
Dominican vs Blackfeet Female Unemployment Correlation Chart
The statistical analysis conducted on geographies consisting of 353,758,930 people shows a mild positive correlation between the proportion of Dominicans and unemploymnet rate among females in the United States with a correlation coefficient (R) of 0.380 and weighted average of 7.2%. Similarly, the statistical analysis conducted on geographies consisting of 308,006,110 people shows a substantial positive correlation between the proportion of Blackfeet and unemploymnet rate among females in the United States with a correlation coefficient (R) of 0.502 and weighted average of 5.9%, a difference of 22.4%.
Female Unemployment Correlation Summary
| Measurement | Dominican | Blackfeet |
| Minimum | 2.3% | 2.5% |
| Maximum | 16.7% | 47.4% |
| Range | 14.4% | 44.9% |
| Mean | 8.1% | 10.8% |
| Median | 7.4% | 6.9% |
| Interquartile 25% (IQ1) | 6.0% | 5.3% |
| Interquartile 75% (IQ3) | 10.1% | 14.8% |
| Interquartile Range (IQR) | 4.1% | 9.5% |
| Standard Deviation (Sample) | 2.8% | 9.1% |
| Standard Deviation (Population) | 2.7% | 9.0% |
Similar Demographics by Female Unemployment
Demographics Similar to Dominicans by Female Unemployment
In terms of female unemployment, the demographic groups most similar to Dominicans are Immigrants from Dominican Republic (7.2%, a difference of 0.64%), Immigrants from Armenia (7.1%, a difference of 1.4%), Navajo (7.3%, a difference of 1.6%), Menominee (7.0%, a difference of 1.8%), and Sioux (7.0%, a difference of 1.8%).
| Demographics | Rating | Rank | Female Unemployment |
| Guyanese | 0.0 /100 | #328 | Tragic 6.7% |
| Immigrants | Guyana | 0.0 /100 | #329 | Tragic 6.7% |
| Yakama | 0.0 /100 | #330 | Tragic 6.7% |
| Paiute | 0.0 /100 | #331 | Tragic 6.8% |
| Sioux | 0.0 /100 | #332 | Tragic 7.0% |
| Menominee | 0.0 /100 | #333 | Tragic 7.0% |
| Immigrants | Armenia | 0.0 /100 | #334 | Tragic 7.1% |
| Dominicans | 0.0 /100 | #335 | Tragic 7.2% |
| Immigrants | Dominican Republic | 0.0 /100 | #336 | Tragic 7.2% |
| Navajo | 0.0 /100 | #337 | Tragic 7.3% |
| Tohono O'odham | 0.0 /100 | #338 | Tragic 7.7% |
| Immigrants | Yemen | 0.0 /100 | #339 | Tragic 7.8% |
| Hopi | 0.0 /100 | #340 | Tragic 8.1% |
| Inupiat | 0.0 /100 | #341 | Tragic 8.2% |
| Puerto Ricans | 0.0 /100 | #342 | Tragic 8.3% |
Demographics Similar to Blackfeet by Female Unemployment
In terms of female unemployment, the demographic groups most similar to Blackfeet are Cape Verdean (5.9%, a difference of 0.28%), Nepalese (5.9%, a difference of 0.39%), Immigrants from Bahamas (5.8%, a difference of 0.40%), Honduran (5.9%, a difference of 0.48%), and Immigrants from Western Africa (5.9%, a difference of 0.69%).
| Demographics | Rating | Rank | Female Unemployment |
| Immigrants | Portugal | 0.2 /100 | #258 | Tragic 5.8% |
| Immigrants | Fiji | 0.2 /100 | #259 | Tragic 5.8% |
| Nigerians | 0.2 /100 | #260 | Tragic 5.8% |
| Kiowa | 0.1 /100 | #261 | Tragic 5.8% |
| Immigrants | Nigeria | 0.1 /100 | #262 | Tragic 5.8% |
| Immigrants | Azores | 0.1 /100 | #263 | Tragic 5.8% |
| Immigrants | Bahamas | 0.1 /100 | #264 | Tragic 5.8% |
| Blackfeet | 0.0 /100 | #265 | Tragic 5.9% |
| Cape Verdeans | 0.0 /100 | #266 | Tragic 5.9% |
| Nepalese | 0.0 /100 | #267 | Tragic 5.9% |
| Hondurans | 0.0 /100 | #268 | Tragic 5.9% |
| Immigrants | Western Africa | 0.0 /100 | #269 | Tragic 5.9% |
| Immigrants | Honduras | 0.0 /100 | #270 | Tragic 5.9% |
| Central Americans | 0.0 /100 | #271 | Tragic 5.9% |
| Lumbee | 0.0 /100 | #272 | Tragic 5.9% |