Puget Sound Salish vs Indian (Asian) Female Unemployment
COMPARE
Puget Sound Salish
Indian (Asian)
Female Unemployment
Female Unemployment Comparison
Puget Sound Salish
Indians (Asian)
5.1%
FEMALE UNEMPLOYMENT
93.0/ 100
METRIC RATING
108th/ 347
METRIC RANK
5.1%
FEMALE UNEMPLOYMENT
84.2/ 100
METRIC RATING
136th/ 347
METRIC RANK
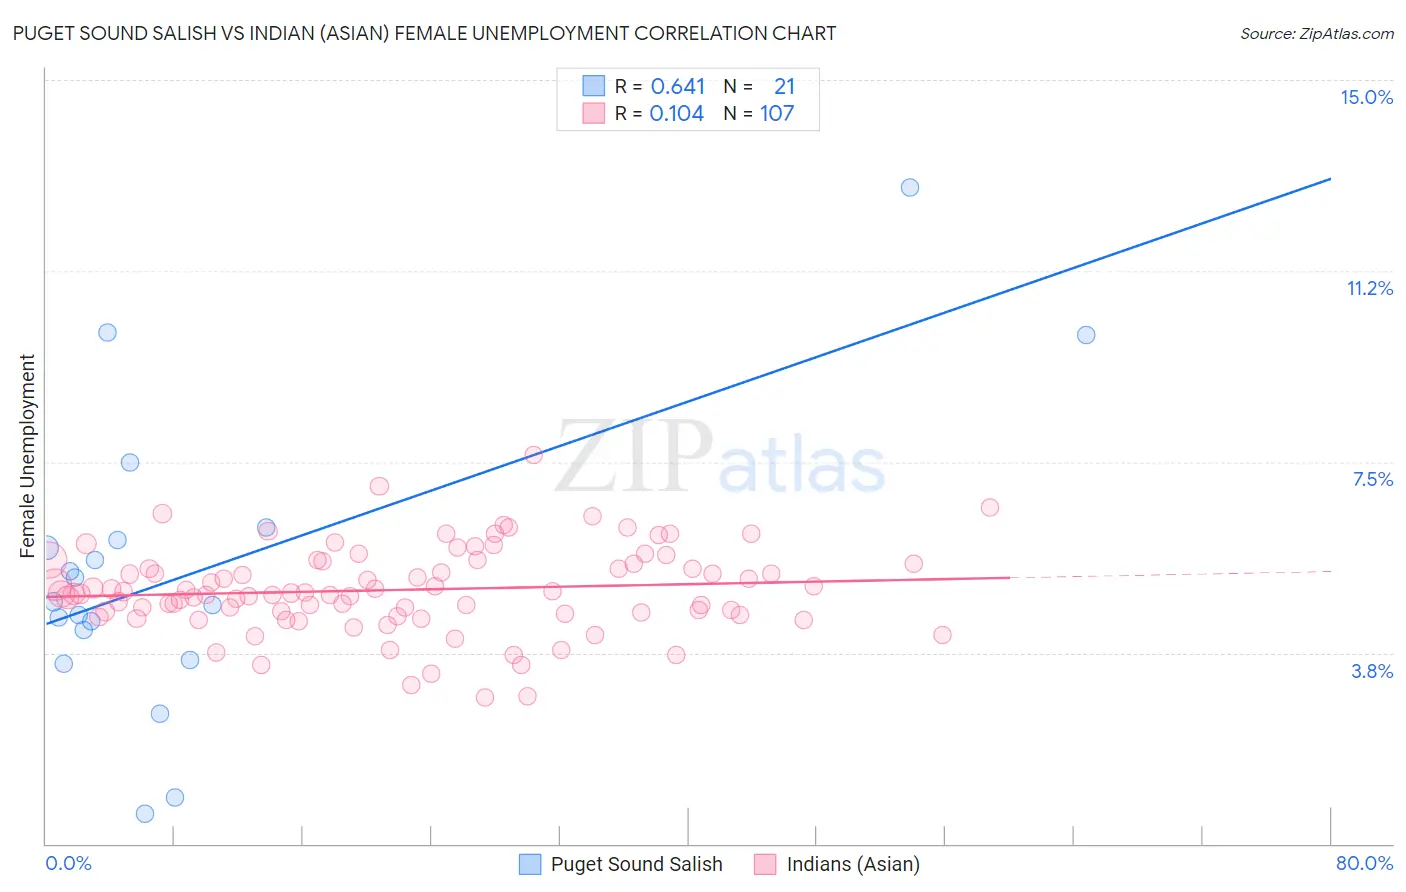
Puget Sound Salish vs Indian (Asian) Female Unemployment Correlation Chart
The statistical analysis conducted on geographies consisting of 46,055,319 people shows a significant positive correlation between the proportion of Puget Sound Salish and unemploymnet rate among females in the United States with a correlation coefficient (R) of 0.641 and weighted average of 5.1%. Similarly, the statistical analysis conducted on geographies consisting of 491,024,006 people shows a poor positive correlation between the proportion of Indians (Asian) and unemploymnet rate among females in the United States with a correlation coefficient (R) of 0.104 and weighted average of 5.1%, a difference of 1.4%.
Female Unemployment Correlation Summary
| Measurement | Puget Sound Salish | Indian (Asian) |
| Minimum | 0.60% | 2.9% |
| Maximum | 12.9% | 7.6% |
| Range | 12.3% | 4.8% |
| Mean | 5.4% | 5.0% |
| Median | 4.8% | 4.9% |
| Interquartile 25% (IQ1) | 3.9% | 4.5% |
| Interquartile 75% (IQ3) | 6.1% | 5.5% |
| Interquartile Range (IQR) | 2.2% | 0.98% |
| Standard Deviation (Sample) | 2.9% | 0.84% |
| Standard Deviation (Population) | 2.8% | 0.84% |
Similar Demographics by Female Unemployment
Demographics Similar to Puget Sound Salish by Female Unemployment
In terms of female unemployment, the demographic groups most similar to Puget Sound Salish are Immigrants from Switzerland (5.1%, a difference of 0.020%), Immigrants from Eastern Africa (5.1%, a difference of 0.040%), Paraguayan (5.1%, a difference of 0.050%), Immigrants from England (5.0%, a difference of 0.14%), and Macedonian (5.1%, a difference of 0.14%).
| Demographics | Rating | Rank | Female Unemployment |
| Immigrants | Czechoslovakia | 95.0 /100 | #101 | Exceptional 5.0% |
| Immigrants | Kenya | 94.8 /100 | #102 | Exceptional 5.0% |
| Somalis | 94.6 /100 | #103 | Exceptional 5.0% |
| Kenyans | 93.7 /100 | #104 | Exceptional 5.0% |
| Immigrants | England | 93.6 /100 | #105 | Exceptional 5.0% |
| Paraguayans | 93.2 /100 | #106 | Exceptional 5.1% |
| Immigrants | Switzerland | 93.1 /100 | #107 | Exceptional 5.1% |
| Puget Sound Salish | 93.0 /100 | #108 | Exceptional 5.1% |
| Immigrants | Eastern Africa | 92.8 /100 | #109 | Exceptional 5.1% |
| Macedonians | 92.4 /100 | #110 | Exceptional 5.1% |
| Immigrants | Burma/Myanmar | 92.3 /100 | #111 | Exceptional 5.1% |
| Estonians | 92.1 /100 | #112 | Exceptional 5.1% |
| Immigrants | Saudi Arabia | 91.2 /100 | #113 | Exceptional 5.1% |
| Immigrants | Turkey | 91.0 /100 | #114 | Exceptional 5.1% |
| Lebanese | 91.0 /100 | #115 | Exceptional 5.1% |
Demographics Similar to Indians (Asian) by Female Unemployment
In terms of female unemployment, the demographic groups most similar to Indians (Asian) are Pakistani (5.1%, a difference of 0.040%), Immigrants from Eritrea (5.1%, a difference of 0.050%), Immigrants from Latvia (5.1%, a difference of 0.050%), Immigrants from Hong Kong (5.1%, a difference of 0.070%), and Immigrants from Sri Lanka (5.1%, a difference of 0.090%).
| Demographics | Rating | Rank | Female Unemployment |
| Ethiopians | 85.7 /100 | #129 | Excellent 5.1% |
| Maltese | 85.5 /100 | #130 | Excellent 5.1% |
| Immigrants | Ethiopia | 85.4 /100 | #131 | Excellent 5.1% |
| Immigrants | Sri Lanka | 85.0 /100 | #132 | Excellent 5.1% |
| Immigrants | Hong Kong | 84.8 /100 | #133 | Excellent 5.1% |
| Immigrants | Eritrea | 84.6 /100 | #134 | Excellent 5.1% |
| Immigrants | Latvia | 84.6 /100 | #135 | Excellent 5.1% |
| Indians (Asian) | 84.2 /100 | #136 | Excellent 5.1% |
| Pakistanis | 83.8 /100 | #137 | Excellent 5.1% |
| Chickasaw | 83.2 /100 | #138 | Excellent 5.1% |
| Immigrants | Eastern Asia | 83.0 /100 | #139 | Excellent 5.1% |
| Immigrants | France | 82.7 /100 | #140 | Excellent 5.1% |
| Immigrants | Eastern Europe | 81.5 /100 | #141 | Excellent 5.1% |
| Palestinians | 80.8 /100 | #142 | Excellent 5.1% |
| Immigrants | Kazakhstan | 80.7 /100 | #143 | Excellent 5.1% |