Dominican vs Senegalese Female Unemployment
COMPARE
Dominican
Senegalese
Female Unemployment
Female Unemployment Comparison
Dominicans
Senegalese
7.2%
FEMALE UNEMPLOYMENT
0.0/ 100
METRIC RATING
335th/ 347
METRIC RANK
6.0%
FEMALE UNEMPLOYMENT
0.0/ 100
METRIC RATING
275th/ 347
METRIC RANK
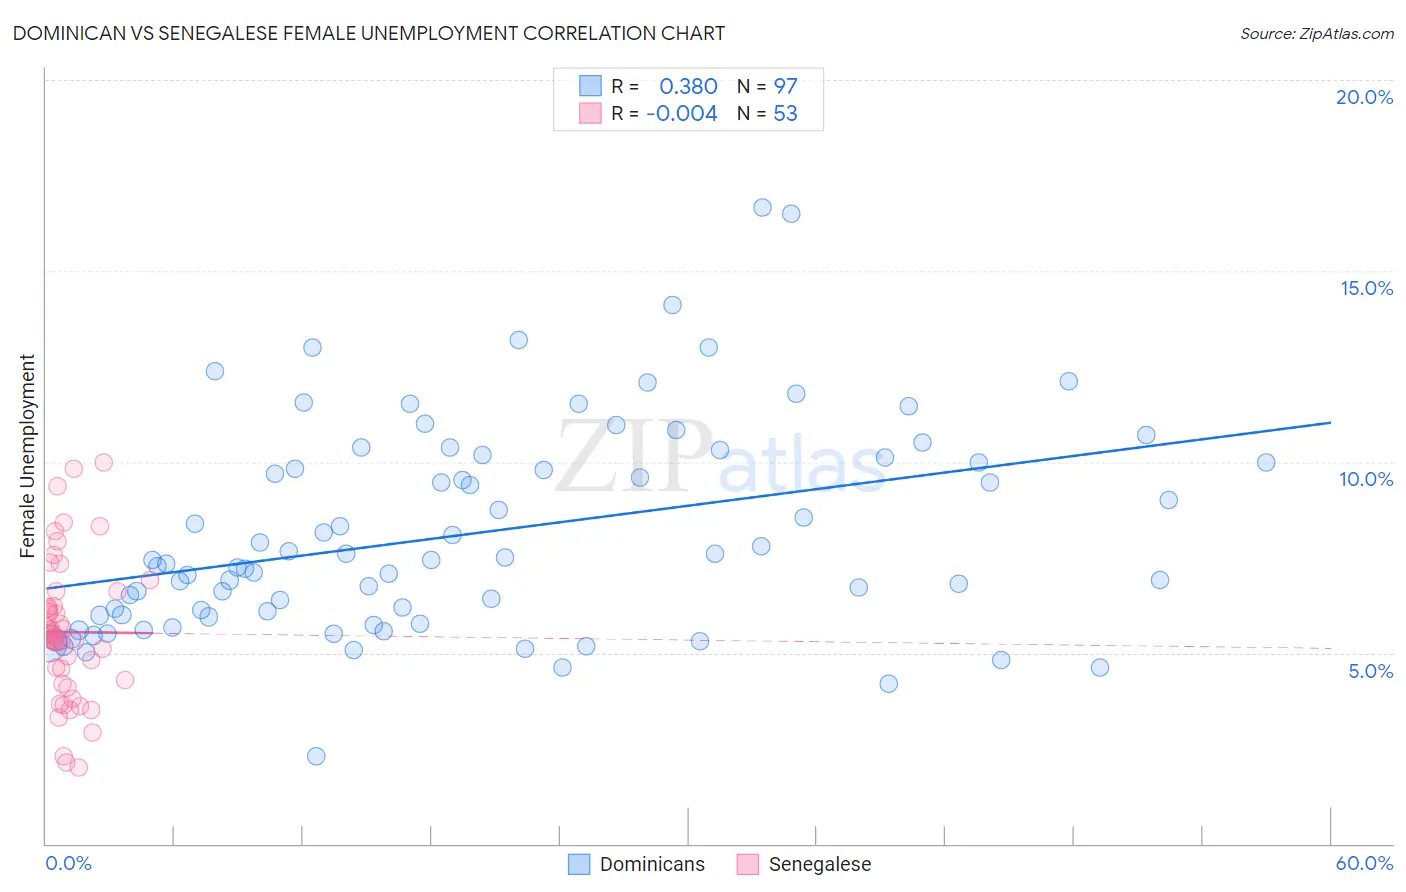
Dominican vs Senegalese Female Unemployment Correlation Chart
The statistical analysis conducted on geographies consisting of 353,758,930 people shows a mild positive correlation between the proportion of Dominicans and unemploymnet rate among females in the United States with a correlation coefficient (R) of 0.380 and weighted average of 7.2%. Similarly, the statistical analysis conducted on geographies consisting of 78,123,834 people shows no correlation between the proportion of Senegalese and unemploymnet rate among females in the United States with a correlation coefficient (R) of -0.004 and weighted average of 6.0%, a difference of 20.0%.
Female Unemployment Correlation Summary
| Measurement | Dominican | Senegalese |
| Minimum | 2.3% | 2.0% |
| Maximum | 16.7% | 10.0% |
| Range | 14.4% | 8.0% |
| Mean | 8.1% | 5.5% |
| Median | 7.4% | 5.4% |
| Interquartile 25% (IQ1) | 6.0% | 4.3% |
| Interquartile 75% (IQ3) | 10.1% | 6.4% |
| Interquartile Range (IQR) | 4.1% | 2.2% |
| Standard Deviation (Sample) | 2.8% | 1.8% |
| Standard Deviation (Population) | 2.7% | 1.8% |
Similar Demographics by Female Unemployment
Demographics Similar to Dominicans by Female Unemployment
In terms of female unemployment, the demographic groups most similar to Dominicans are Immigrants from Dominican Republic (7.2%, a difference of 0.64%), Immigrants from Armenia (7.1%, a difference of 1.4%), Navajo (7.3%, a difference of 1.6%), Menominee (7.0%, a difference of 1.8%), and Sioux (7.0%, a difference of 1.8%).
| Demographics | Rating | Rank | Female Unemployment |
| Guyanese | 0.0 /100 | #328 | Tragic 6.7% |
| Immigrants | Guyana | 0.0 /100 | #329 | Tragic 6.7% |
| Yakama | 0.0 /100 | #330 | Tragic 6.7% |
| Paiute | 0.0 /100 | #331 | Tragic 6.8% |
| Sioux | 0.0 /100 | #332 | Tragic 7.0% |
| Menominee | 0.0 /100 | #333 | Tragic 7.0% |
| Immigrants | Armenia | 0.0 /100 | #334 | Tragic 7.1% |
| Dominicans | 0.0 /100 | #335 | Tragic 7.2% |
| Immigrants | Dominican Republic | 0.0 /100 | #336 | Tragic 7.2% |
| Navajo | 0.0 /100 | #337 | Tragic 7.3% |
| Tohono O'odham | 0.0 /100 | #338 | Tragic 7.7% |
| Immigrants | Yemen | 0.0 /100 | #339 | Tragic 7.8% |
| Hopi | 0.0 /100 | #340 | Tragic 8.1% |
| Inupiat | 0.0 /100 | #341 | Tragic 8.2% |
| Puerto Ricans | 0.0 /100 | #342 | Tragic 8.3% |
Demographics Similar to Senegalese by Female Unemployment
In terms of female unemployment, the demographic groups most similar to Senegalese are Bahamian (6.0%, a difference of 0.040%), Immigrants from Ghana (6.0%, a difference of 0.43%), Yaqui (6.0%, a difference of 0.43%), African (5.9%, a difference of 0.49%), and Armenian (6.0%, a difference of 0.55%).
| Demographics | Rating | Rank | Female Unemployment |
| Hondurans | 0.0 /100 | #268 | Tragic 5.9% |
| Immigrants | Western Africa | 0.0 /100 | #269 | Tragic 5.9% |
| Immigrants | Honduras | 0.0 /100 | #270 | Tragic 5.9% |
| Central Americans | 0.0 /100 | #271 | Tragic 5.9% |
| Lumbee | 0.0 /100 | #272 | Tragic 5.9% |
| Ghanaians | 0.0 /100 | #273 | Tragic 5.9% |
| Africans | 0.0 /100 | #274 | Tragic 5.9% |
| Senegalese | 0.0 /100 | #275 | Tragic 6.0% |
| Bahamians | 0.0 /100 | #276 | Tragic 6.0% |
| Immigrants | Ghana | 0.0 /100 | #277 | Tragic 6.0% |
| Yaqui | 0.0 /100 | #278 | Tragic 6.0% |
| Armenians | 0.0 /100 | #279 | Tragic 6.0% |
| Mexican American Indians | 0.0 /100 | #280 | Tragic 6.0% |
| Guatemalans | 0.0 /100 | #281 | Tragic 6.0% |
| Colville | 0.0 /100 | #282 | Tragic 6.0% |