Creek vs U.S. Virgin Islander Male Unemployment
COMPARE
Creek
U.S. Virgin Islander
Male Unemployment
Male Unemployment Comparison
Creek
U.S. Virgin Islanders
5.6%
MALE UNEMPLOYMENT
2.6/ 100
METRIC RATING
223rd/ 347
METRIC RANK
6.4%
MALE UNEMPLOYMENT
0.0/ 100
METRIC RATING
290th/ 347
METRIC RANK
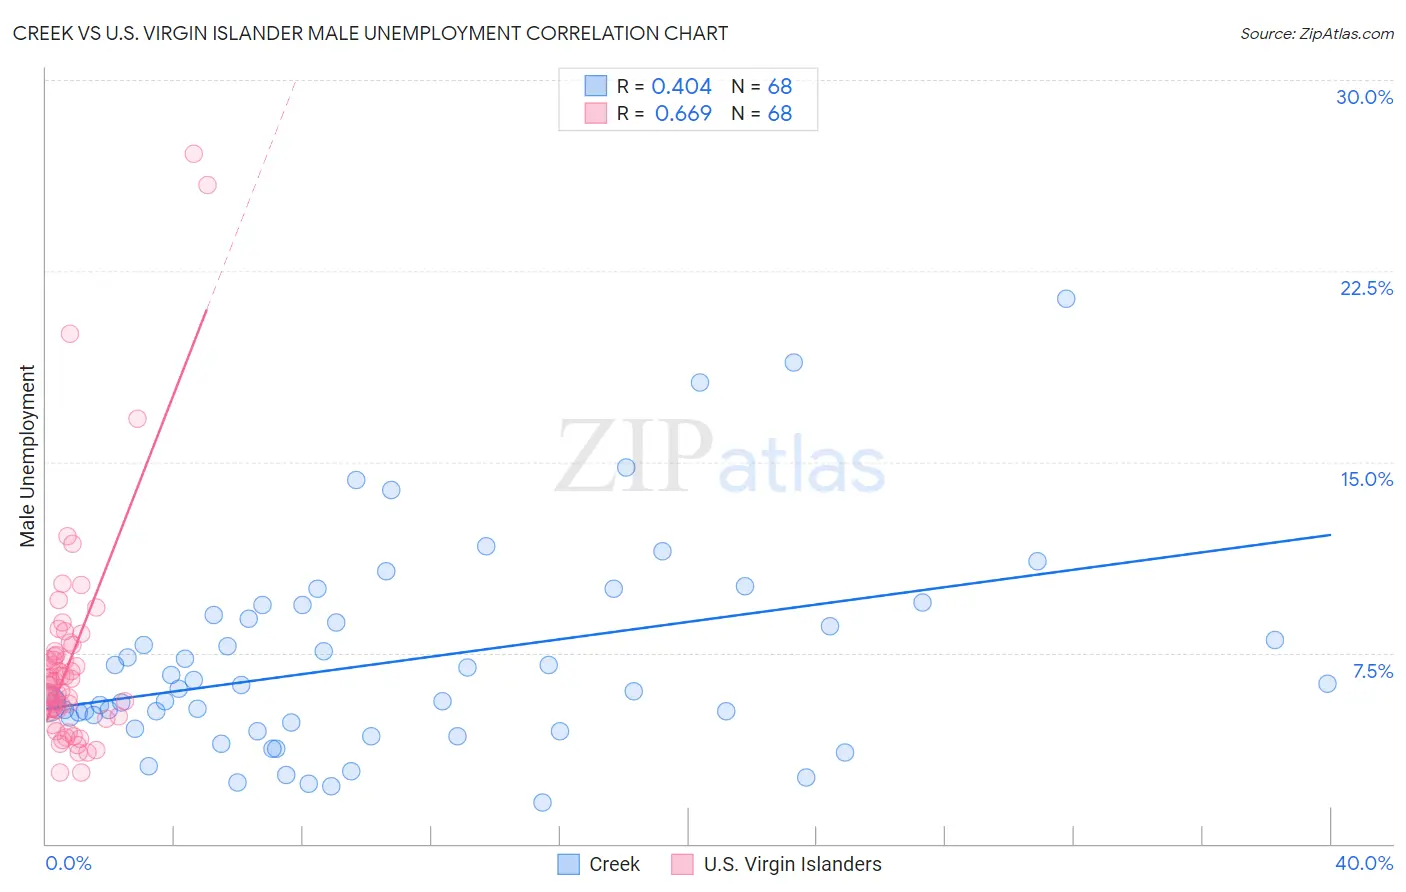
Creek vs U.S. Virgin Islander Male Unemployment Correlation Chart
The statistical analysis conducted on geographies consisting of 177,831,732 people shows a moderate positive correlation between the proportion of Creek and unemployment rate among males in the United States with a correlation coefficient (R) of 0.404 and weighted average of 5.6%. Similarly, the statistical analysis conducted on geographies consisting of 87,502,390 people shows a significant positive correlation between the proportion of U.S. Virgin Islanders and unemployment rate among males in the United States with a correlation coefficient (R) of 0.669 and weighted average of 6.4%, a difference of 14.5%.
Male Unemployment Correlation Summary
| Measurement | Creek | U.S. Virgin Islander |
| Minimum | 1.6% | 2.8% |
| Maximum | 21.4% | 27.1% |
| Range | 19.8% | 24.3% |
| Mean | 7.1% | 7.2% |
| Median | 6.1% | 6.3% |
| Interquartile 25% (IQ1) | 4.7% | 5.2% |
| Interquartile 75% (IQ3) | 8.9% | 7.5% |
| Interquartile Range (IQR) | 4.3% | 2.3% |
| Standard Deviation (Sample) | 4.0% | 4.4% |
| Standard Deviation (Population) | 3.9% | 4.4% |
Similar Demographics by Male Unemployment
Demographics Similar to Creek by Male Unemployment
In terms of male unemployment, the demographic groups most similar to Creek are Cherokee (5.6%, a difference of 0.13%), Immigrants from Micronesia (5.6%, a difference of 0.15%), Soviet Union (5.6%, a difference of 0.29%), Portuguese (5.6%, a difference of 0.40%), and Immigrants from Western Asia (5.6%, a difference of 0.42%).
| Demographics | Rating | Rank | Male Unemployment |
| Immigrants | Immigrants | 4.3 /100 | #216 | Tragic 5.5% |
| Delaware | 4.2 /100 | #217 | Tragic 5.5% |
| Immigrants | Albania | 3.6 /100 | #218 | Tragic 5.5% |
| Immigrants | Western Asia | 3.5 /100 | #219 | Tragic 5.6% |
| Portuguese | 3.5 /100 | #220 | Tragic 5.6% |
| Soviet Union | 3.2 /100 | #221 | Tragic 5.6% |
| Immigrants | Micronesia | 2.9 /100 | #222 | Tragic 5.6% |
| Creek | 2.6 /100 | #223 | Tragic 5.6% |
| Cherokee | 2.4 /100 | #224 | Tragic 5.6% |
| Panamanians | 1.9 /100 | #225 | Tragic 5.6% |
| Immigrants | Cambodia | 1.8 /100 | #226 | Tragic 5.6% |
| Immigrants | Panama | 1.8 /100 | #227 | Tragic 5.6% |
| Seminole | 1.8 /100 | #228 | Tragic 5.6% |
| Central Americans | 1.8 /100 | #229 | Tragic 5.6% |
| Immigrants | Africa | 1.7 /100 | #230 | Tragic 5.6% |
Demographics Similar to U.S. Virgin Islanders by Male Unemployment
In terms of male unemployment, the demographic groups most similar to U.S. Virgin Islanders are Immigrants from the Azores (6.4%, a difference of 0.52%), Nepalese (6.4%, a difference of 0.87%), Haitian (6.4%, a difference of 0.90%), Senegalese (6.4%, a difference of 1.0%), and Immigrants from Caribbean (6.3%, a difference of 1.6%).
| Demographics | Rating | Rank | Male Unemployment |
| Immigrants | Western Africa | 0.0 /100 | #283 | Tragic 6.2% |
| Spanish American Indians | 0.0 /100 | #284 | Tragic 6.2% |
| Immigrants | Ecuador | 0.0 /100 | #285 | Tragic 6.2% |
| Africans | 0.0 /100 | #286 | Tragic 6.3% |
| Central American Indians | 0.0 /100 | #287 | Tragic 6.3% |
| Immigrants | Senegal | 0.0 /100 | #288 | Tragic 6.3% |
| Immigrants | Caribbean | 0.0 /100 | #289 | Tragic 6.3% |
| U.S. Virgin Islanders | 0.0 /100 | #290 | Tragic 6.4% |
| Immigrants | Azores | 0.0 /100 | #291 | Tragic 6.4% |
| Nepalese | 0.0 /100 | #292 | Tragic 6.4% |
| Haitians | 0.0 /100 | #293 | Tragic 6.4% |
| Senegalese | 0.0 /100 | #294 | Tragic 6.4% |
| Belizeans | 0.0 /100 | #295 | Tragic 6.5% |
| Immigrants | Haiti | 0.0 /100 | #296 | Tragic 6.5% |
| Chippewa | 0.0 /100 | #297 | Tragic 6.6% |