Shoshone vs U.S. Virgin Islander Male Unemployment
COMPARE
Shoshone
U.S. Virgin Islander
Male Unemployment
Male Unemployment Comparison
Shoshone
U.S. Virgin Islanders
7.6%
MALE UNEMPLOYMENT
0.0/ 100
METRIC RATING
325th/ 347
METRIC RANK
6.4%
MALE UNEMPLOYMENT
0.0/ 100
METRIC RATING
290th/ 347
METRIC RANK
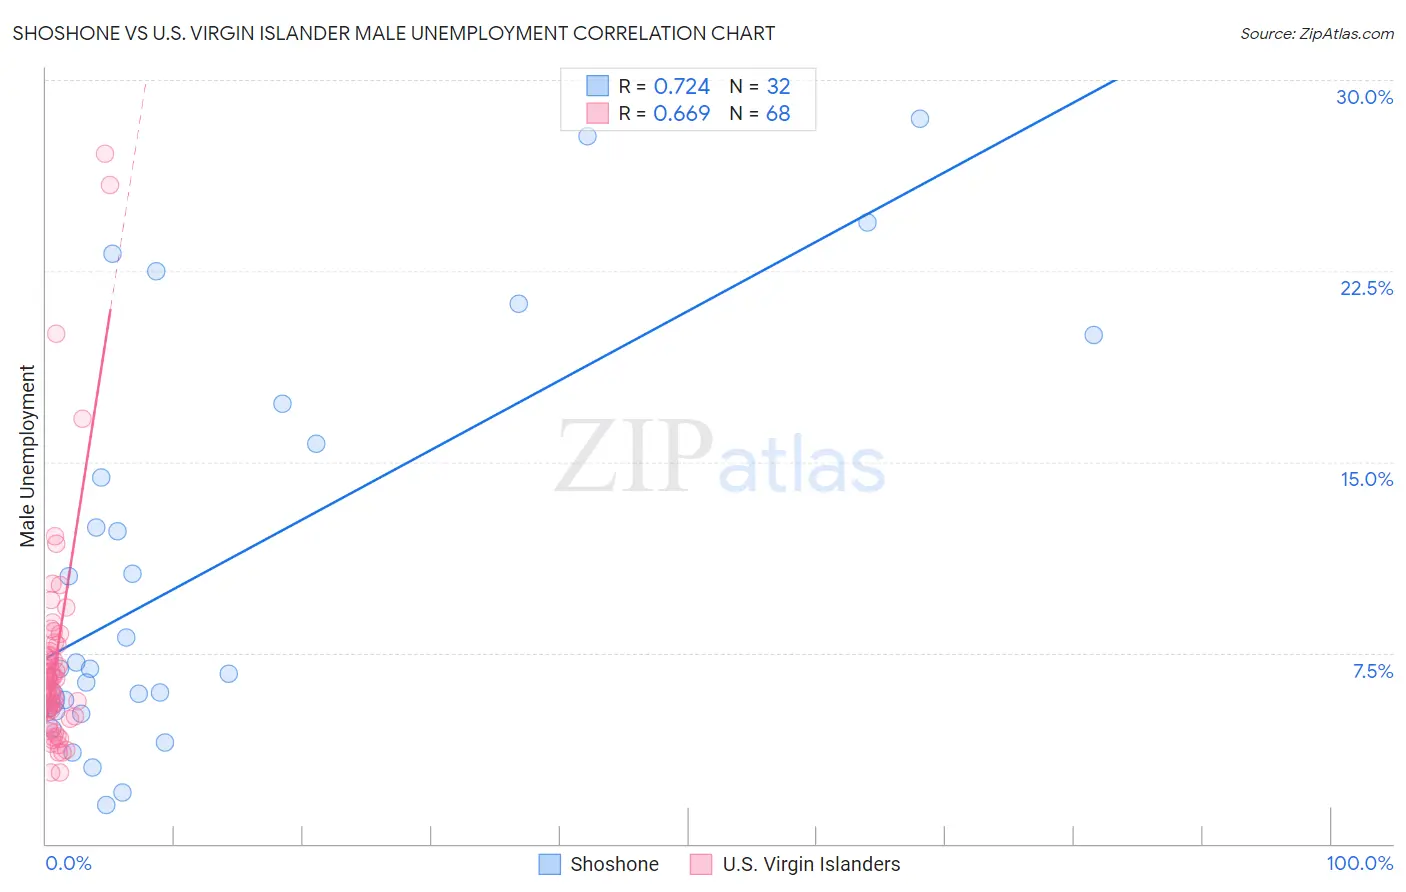
Shoshone vs U.S. Virgin Islander Male Unemployment Correlation Chart
The statistical analysis conducted on geographies consisting of 66,510,535 people shows a strong positive correlation between the proportion of Shoshone and unemployment rate among males in the United States with a correlation coefficient (R) of 0.724 and weighted average of 7.6%. Similarly, the statistical analysis conducted on geographies consisting of 87,502,390 people shows a significant positive correlation between the proportion of U.S. Virgin Islanders and unemployment rate among males in the United States with a correlation coefficient (R) of 0.669 and weighted average of 6.4%, a difference of 19.1%.
Male Unemployment Correlation Summary
| Measurement | Shoshone | U.S. Virgin Islander |
| Minimum | 1.5% | 2.8% |
| Maximum | 28.5% | 27.1% |
| Range | 27.0% | 24.3% |
| Mean | 11.1% | 7.2% |
| Median | 7.0% | 6.3% |
| Interquartile 25% (IQ1) | 5.4% | 5.2% |
| Interquartile 75% (IQ3) | 16.5% | 7.5% |
| Interquartile Range (IQR) | 11.1% | 2.3% |
| Standard Deviation (Sample) | 8.0% | 4.4% |
| Standard Deviation (Population) | 7.8% | 4.4% |
Similar Demographics by Male Unemployment
Demographics Similar to Shoshone by Male Unemployment
In terms of male unemployment, the demographic groups most similar to Shoshone are Immigrants from Dominican Republic (7.6%, a difference of 0.10%), Dominican (7.6%, a difference of 0.37%), Immigrants from Grenada (7.6%, a difference of 0.65%), Paiute (7.7%, a difference of 1.2%), and Immigrants from Cabo Verde (7.5%, a difference of 1.4%).
| Demographics | Rating | Rank | Male Unemployment |
| Cape Verdeans | 0.0 /100 | #318 | Tragic 7.1% |
| British West Indians | 0.0 /100 | #319 | Tragic 7.3% |
| Colville | 0.0 /100 | #320 | Tragic 7.4% |
| Immigrants | St. Vincent and the Grenadines | 0.0 /100 | #321 | Tragic 7.5% |
| Immigrants | Cabo Verde | 0.0 /100 | #322 | Tragic 7.5% |
| Immigrants | Grenada | 0.0 /100 | #323 | Tragic 7.6% |
| Dominicans | 0.0 /100 | #324 | Tragic 7.6% |
| Shoshone | 0.0 /100 | #325 | Tragic 7.6% |
| Immigrants | Dominican Republic | 0.0 /100 | #326 | Tragic 7.6% |
| Paiute | 0.0 /100 | #327 | Tragic 7.7% |
| Natives/Alaskans | 0.0 /100 | #328 | Tragic 7.7% |
| Immigrants | Yemen | 0.0 /100 | #329 | Tragic 7.8% |
| Yakama | 0.0 /100 | #330 | Tragic 7.9% |
| Alaska Natives | 0.0 /100 | #331 | Tragic 8.1% |
| Pima | 0.0 /100 | #332 | Tragic 8.3% |
Demographics Similar to U.S. Virgin Islanders by Male Unemployment
In terms of male unemployment, the demographic groups most similar to U.S. Virgin Islanders are Immigrants from the Azores (6.4%, a difference of 0.52%), Nepalese (6.4%, a difference of 0.87%), Haitian (6.4%, a difference of 0.90%), Senegalese (6.4%, a difference of 1.0%), and Immigrants from Caribbean (6.3%, a difference of 1.6%).
| Demographics | Rating | Rank | Male Unemployment |
| Immigrants | Western Africa | 0.0 /100 | #283 | Tragic 6.2% |
| Spanish American Indians | 0.0 /100 | #284 | Tragic 6.2% |
| Immigrants | Ecuador | 0.0 /100 | #285 | Tragic 6.2% |
| Africans | 0.0 /100 | #286 | Tragic 6.3% |
| Central American Indians | 0.0 /100 | #287 | Tragic 6.3% |
| Immigrants | Senegal | 0.0 /100 | #288 | Tragic 6.3% |
| Immigrants | Caribbean | 0.0 /100 | #289 | Tragic 6.3% |
| U.S. Virgin Islanders | 0.0 /100 | #290 | Tragic 6.4% |
| Immigrants | Azores | 0.0 /100 | #291 | Tragic 6.4% |
| Nepalese | 0.0 /100 | #292 | Tragic 6.4% |
| Haitians | 0.0 /100 | #293 | Tragic 6.4% |
| Senegalese | 0.0 /100 | #294 | Tragic 6.4% |
| Belizeans | 0.0 /100 | #295 | Tragic 6.5% |
| Immigrants | Haiti | 0.0 /100 | #296 | Tragic 6.5% |
| Chippewa | 0.0 /100 | #297 | Tragic 6.6% |