Creek vs Immigrants from Greece Male Unemployment
COMPARE
Creek
Immigrants from Greece
Male Unemployment
Male Unemployment Comparison
Creek
Immigrants from Greece
5.6%
MALE UNEMPLOYMENT
2.6/ 100
METRIC RATING
223rd/ 347
METRIC RANK
5.4%
MALE UNEMPLOYMENT
14.5/ 100
METRIC RATING
199th/ 347
METRIC RANK
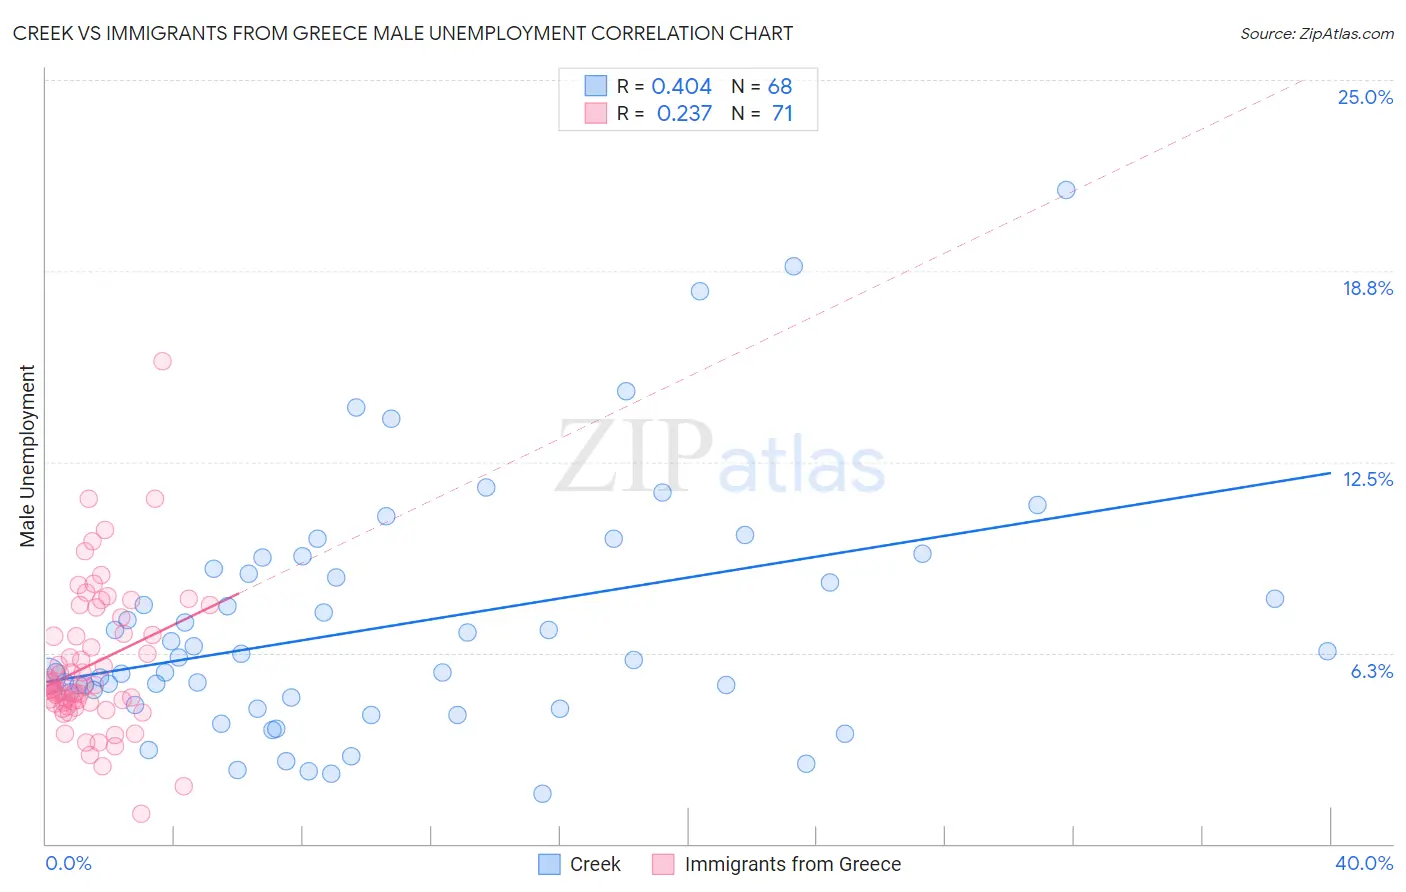
Creek vs Immigrants from Greece Male Unemployment Correlation Chart
The statistical analysis conducted on geographies consisting of 177,831,732 people shows a moderate positive correlation between the proportion of Creek and unemployment rate among males in the United States with a correlation coefficient (R) of 0.404 and weighted average of 5.6%. Similarly, the statistical analysis conducted on geographies consisting of 216,564,695 people shows a weak positive correlation between the proportion of Immigrants from Greece and unemployment rate among males in the United States with a correlation coefficient (R) of 0.237 and weighted average of 5.4%, a difference of 2.6%.
Male Unemployment Correlation Summary
| Measurement | Creek | Immigrants from Greece |
| Minimum | 1.6% | 1.0% |
| Maximum | 21.4% | 15.8% |
| Range | 19.8% | 14.8% |
| Mean | 7.1% | 5.9% |
| Median | 6.1% | 5.2% |
| Interquartile 25% (IQ1) | 4.7% | 4.6% |
| Interquartile 75% (IQ3) | 8.9% | 7.4% |
| Interquartile Range (IQR) | 4.3% | 2.8% |
| Standard Deviation (Sample) | 4.0% | 2.4% |
| Standard Deviation (Population) | 3.9% | 2.4% |
Similar Demographics by Male Unemployment
Demographics Similar to Creek by Male Unemployment
In terms of male unemployment, the demographic groups most similar to Creek are Cherokee (5.6%, a difference of 0.13%), Immigrants from Micronesia (5.6%, a difference of 0.15%), Soviet Union (5.6%, a difference of 0.29%), Portuguese (5.6%, a difference of 0.40%), and Immigrants from Western Asia (5.6%, a difference of 0.42%).
| Demographics | Rating | Rank | Male Unemployment |
| Immigrants | Immigrants | 4.3 /100 | #216 | Tragic 5.5% |
| Delaware | 4.2 /100 | #217 | Tragic 5.5% |
| Immigrants | Albania | 3.6 /100 | #218 | Tragic 5.5% |
| Immigrants | Western Asia | 3.5 /100 | #219 | Tragic 5.6% |
| Portuguese | 3.5 /100 | #220 | Tragic 5.6% |
| Soviet Union | 3.2 /100 | #221 | Tragic 5.6% |
| Immigrants | Micronesia | 2.9 /100 | #222 | Tragic 5.6% |
| Creek | 2.6 /100 | #223 | Tragic 5.6% |
| Cherokee | 2.4 /100 | #224 | Tragic 5.6% |
| Panamanians | 1.9 /100 | #225 | Tragic 5.6% |
| Immigrants | Cambodia | 1.8 /100 | #226 | Tragic 5.6% |
| Immigrants | Panama | 1.8 /100 | #227 | Tragic 5.6% |
| Seminole | 1.8 /100 | #228 | Tragic 5.6% |
| Central Americans | 1.8 /100 | #229 | Tragic 5.6% |
| Immigrants | Africa | 1.7 /100 | #230 | Tragic 5.6% |
Demographics Similar to Immigrants from Greece by Male Unemployment
In terms of male unemployment, the demographic groups most similar to Immigrants from Greece are Immigrants from Thailand (5.4%, a difference of 0.020%), Immigrants from Zaire (5.4%, a difference of 0.10%), Immigrants from Philippines (5.4%, a difference of 0.12%), Nonimmigrants (5.4%, a difference of 0.16%), and Immigrants from Laos (5.4%, a difference of 0.18%).
| Demographics | Rating | Rank | Male Unemployment |
| Immigrants | Belarus | 26.0 /100 | #192 | Fair 5.4% |
| Immigrants | Israel | 25.2 /100 | #193 | Fair 5.4% |
| Spanish | 19.7 /100 | #194 | Poor 5.4% |
| Immigrants | Southern Europe | 17.7 /100 | #195 | Poor 5.4% |
| Albanians | 17.3 /100 | #196 | Poor 5.4% |
| Alsatians | 16.7 /100 | #197 | Poor 5.4% |
| Immigrants | Thailand | 14.7 /100 | #198 | Poor 5.4% |
| Immigrants | Greece | 14.5 /100 | #199 | Poor 5.4% |
| Immigrants | Zaire | 13.7 /100 | #200 | Poor 5.4% |
| Immigrants | Philippines | 13.5 /100 | #201 | Poor 5.4% |
| Immigrants | Nonimmigrants | 13.1 /100 | #202 | Poor 5.4% |
| Immigrants | Laos | 13.0 /100 | #203 | Poor 5.4% |
| Guamanians/Chamorros | 12.3 /100 | #204 | Poor 5.4% |
| Immigrants | Costa Rica | 11.4 /100 | #205 | Poor 5.5% |
| Immigrants | Ukraine | 9.9 /100 | #206 | Tragic 5.5% |