Creek vs U.S. Virgin Islander Seniors Poverty Over the Age of 75
COMPARE
Creek
U.S. Virgin Islander
Seniors Poverty Over the Age of 75
Seniors Poverty Over the Age of 75 Comparison
Creek
U.S. Virgin Islanders
11.6%
SENIORS POVERTY OVER THE AGE OF 75
92.7/ 100
METRIC RATING
94th/ 347
METRIC RANK
15.4%
SENIORS POVERTY OVER THE AGE OF 75
0.0/ 100
METRIC RATING
295th/ 347
METRIC RANK
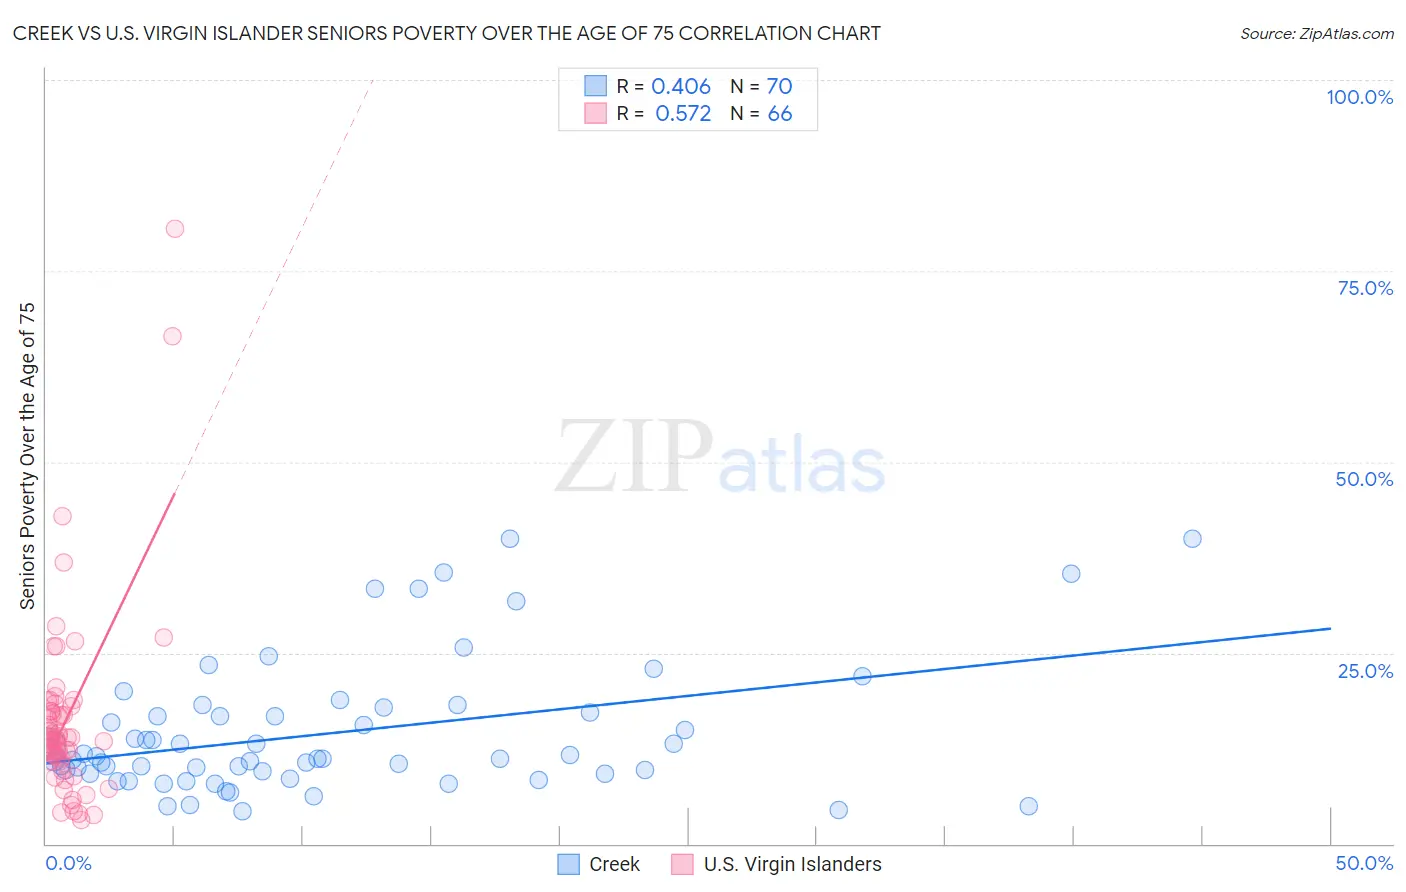
Creek vs U.S. Virgin Islander Seniors Poverty Over the Age of 75 Correlation Chart
The statistical analysis conducted on geographies consisting of 177,296,748 people shows a moderate positive correlation between the proportion of Creek and poverty level among seniors over the age of 75 in the United States with a correlation coefficient (R) of 0.406 and weighted average of 11.6%. Similarly, the statistical analysis conducted on geographies consisting of 87,346,721 people shows a substantial positive correlation between the proportion of U.S. Virgin Islanders and poverty level among seniors over the age of 75 in the United States with a correlation coefficient (R) of 0.572 and weighted average of 15.4%, a difference of 33.0%.
Seniors Poverty Over the Age of 75 Correlation Summary
| Measurement | Creek | U.S. Virgin Islander |
| Minimum | 4.3% | 3.0% |
| Maximum | 40.0% | 80.5% |
| Range | 35.7% | 77.5% |
| Mean | 14.5% | 16.3% |
| Median | 11.1% | 13.8% |
| Interquartile 25% (IQ1) | 9.1% | 11.2% |
| Interquartile 75% (IQ3) | 17.2% | 17.3% |
| Interquartile Range (IQR) | 8.1% | 6.1% |
| Standard Deviation (Sample) | 8.6% | 12.6% |
| Standard Deviation (Population) | 8.5% | 12.5% |
Similar Demographics by Seniors Poverty Over the Age of 75
Demographics Similar to Creek by Seniors Poverty Over the Age of 75
In terms of seniors poverty over the age of 75, the demographic groups most similar to Creek are Immigrants from Bosnia and Herzegovina (11.6%, a difference of 0.040%), Immigrants from Sweden (11.6%, a difference of 0.040%), Immigrants from Poland (11.6%, a difference of 0.050%), Romanian (11.6%, a difference of 0.13%), and Immigrants from Japan (11.6%, a difference of 0.24%).
| Demographics | Rating | Rank | Seniors Poverty Over the Age of 75 |
| Koreans | 94.5 /100 | #87 | Exceptional 11.5% |
| Immigrants | Croatia | 94.5 /100 | #88 | Exceptional 11.5% |
| Immigrants | Sri Lanka | 94.4 /100 | #89 | Exceptional 11.5% |
| Aleuts | 94.1 /100 | #90 | Exceptional 11.5% |
| Immigrants | Germany | 94.1 /100 | #91 | Exceptional 11.5% |
| Kenyans | 93.9 /100 | #92 | Exceptional 11.5% |
| Immigrants | Poland | 92.9 /100 | #93 | Exceptional 11.6% |
| Creek | 92.7 /100 | #94 | Exceptional 11.6% |
| Immigrants | Bosnia and Herzegovina | 92.6 /100 | #95 | Exceptional 11.6% |
| Immigrants | Sweden | 92.6 /100 | #96 | Exceptional 11.6% |
| Romanians | 92.3 /100 | #97 | Exceptional 11.6% |
| Immigrants | Japan | 91.9 /100 | #98 | Exceptional 11.6% |
| Immigrants | Ethiopia | 91.7 /100 | #99 | Exceptional 11.6% |
| Syrians | 91.1 /100 | #100 | Exceptional 11.6% |
| Jordanians | 90.8 /100 | #101 | Exceptional 11.6% |
Demographics Similar to U.S. Virgin Islanders by Seniors Poverty Over the Age of 75
In terms of seniors poverty over the age of 75, the demographic groups most similar to U.S. Virgin Islanders are Yuman (15.4%, a difference of 0.18%), Immigrants from Jamaica (15.3%, a difference of 0.19%), Honduran (15.4%, a difference of 0.46%), Apache (15.3%, a difference of 0.64%), and Native/Alaskan (15.5%, a difference of 0.80%).
| Demographics | Rating | Rank | Seniors Poverty Over the Age of 75 |
| Jamaicans | 0.0 /100 | #288 | Tragic 15.1% |
| Immigrants | Belize | 0.0 /100 | #289 | Tragic 15.2% |
| Immigrants | Azores | 0.0 /100 | #290 | Tragic 15.2% |
| Paiute | 0.0 /100 | #291 | Tragic 15.2% |
| Colville | 0.0 /100 | #292 | Tragic 15.2% |
| Apache | 0.0 /100 | #293 | Tragic 15.3% |
| Immigrants | Jamaica | 0.0 /100 | #294 | Tragic 15.3% |
| U.S. Virgin Islanders | 0.0 /100 | #295 | Tragic 15.4% |
| Yuman | 0.0 /100 | #296 | Tragic 15.4% |
| Hondurans | 0.0 /100 | #297 | Tragic 15.4% |
| Natives/Alaskans | 0.0 /100 | #298 | Tragic 15.5% |
| Spanish American Indians | 0.0 /100 | #299 | Tragic 15.5% |
| Bahamians | 0.0 /100 | #300 | Tragic 15.5% |
| Immigrants | Latin America | 0.0 /100 | #301 | Tragic 15.6% |
| West Indians | 0.0 /100 | #302 | Tragic 15.7% |