Barbadian vs U.S. Virgin Islander Male Unemployment
COMPARE
Barbadian
U.S. Virgin Islander
Male Unemployment
Male Unemployment Comparison
Barbadians
U.S. Virgin Islanders
6.9%
MALE UNEMPLOYMENT
0.0/ 100
METRIC RATING
309th/ 347
METRIC RANK
6.4%
MALE UNEMPLOYMENT
0.0/ 100
METRIC RATING
290th/ 347
METRIC RANK
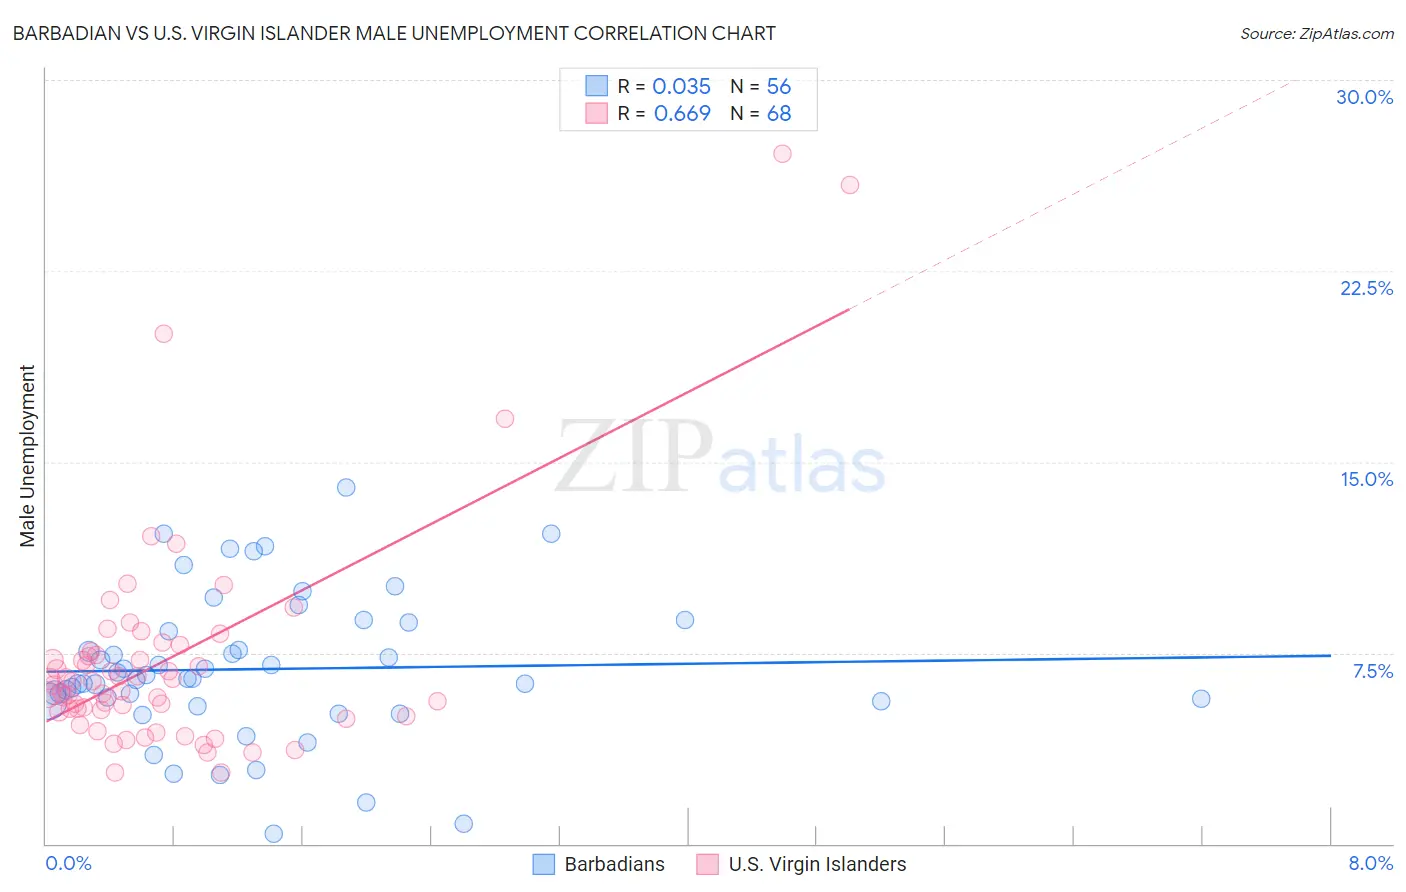
Barbadian vs U.S. Virgin Islander Male Unemployment Correlation Chart
The statistical analysis conducted on geographies consisting of 141,188,365 people shows no correlation between the proportion of Barbadians and unemployment rate among males in the United States with a correlation coefficient (R) of 0.035 and weighted average of 6.9%. Similarly, the statistical analysis conducted on geographies consisting of 87,502,390 people shows a significant positive correlation between the proportion of U.S. Virgin Islanders and unemployment rate among males in the United States with a correlation coefficient (R) of 0.669 and weighted average of 6.4%, a difference of 7.4%.
Male Unemployment Correlation Summary
| Measurement | Barbadian | U.S. Virgin Islander |
| Minimum | 0.40% | 2.8% |
| Maximum | 14.0% | 27.1% |
| Range | 13.6% | 24.3% |
| Mean | 6.9% | 7.2% |
| Median | 6.5% | 6.3% |
| Interquartile 25% (IQ1) | 5.6% | 5.2% |
| Interquartile 75% (IQ3) | 8.5% | 7.5% |
| Interquartile Range (IQR) | 2.9% | 2.3% |
| Standard Deviation (Sample) | 2.8% | 4.4% |
| Standard Deviation (Population) | 2.8% | 4.4% |
Demographics Similar to Barbadians and U.S. Virgin Islanders by Male Unemployment
In terms of male unemployment, the demographic groups most similar to Barbadians are Aleut (6.8%, a difference of 0.41%), Immigrants from Jamaica (6.7%, a difference of 2.3%), Immigrants from Trinidad and Tobago (6.7%, a difference of 2.4%), Trinidadian and Tobagonian (6.7%, a difference of 2.6%), and Immigrants from West Indies (6.7%, a difference of 2.9%). Similarly, the demographic groups most similar to U.S. Virgin Islanders are Immigrants from the Azores (6.4%, a difference of 0.52%), Nepalese (6.4%, a difference of 0.87%), Haitian (6.4%, a difference of 0.90%), Senegalese (6.4%, a difference of 1.0%), and Immigrants from Caribbean (6.3%, a difference of 1.6%).
| Demographics | Rating | Rank | Male Unemployment |
| Immigrants | Caribbean | 0.0 /100 | #289 | Tragic 6.3% |
| U.S. Virgin Islanders | 0.0 /100 | #290 | Tragic 6.4% |
| Immigrants | Azores | 0.0 /100 | #291 | Tragic 6.4% |
| Nepalese | 0.0 /100 | #292 | Tragic 6.4% |
| Haitians | 0.0 /100 | #293 | Tragic 6.4% |
| Senegalese | 0.0 /100 | #294 | Tragic 6.4% |
| Belizeans | 0.0 /100 | #295 | Tragic 6.5% |
| Immigrants | Haiti | 0.0 /100 | #296 | Tragic 6.5% |
| Chippewa | 0.0 /100 | #297 | Tragic 6.6% |
| Jamaicans | 0.0 /100 | #298 | Tragic 6.6% |
| Immigrants | Bangladesh | 0.0 /100 | #299 | Tragic 6.6% |
| Vietnamese | 0.0 /100 | #300 | Tragic 6.6% |
| Immigrants | Belize | 0.0 /100 | #301 | Tragic 6.6% |
| Ute | 0.0 /100 | #302 | Tragic 6.6% |
| Immigrants | West Indies | 0.0 /100 | #303 | Tragic 6.7% |
| West Indians | 0.0 /100 | #304 | Tragic 6.7% |
| Trinidadians and Tobagonians | 0.0 /100 | #305 | Tragic 6.7% |
| Immigrants | Trinidad and Tobago | 0.0 /100 | #306 | Tragic 6.7% |
| Immigrants | Jamaica | 0.0 /100 | #307 | Tragic 6.7% |
| Aleuts | 0.0 /100 | #308 | Tragic 6.8% |
| Barbadians | 0.0 /100 | #309 | Tragic 6.9% |