Marshallese vs U.S. Virgin Islander Male Unemployment
COMPARE
Marshallese
U.S. Virgin Islander
Male Unemployment
Male Unemployment Comparison
Marshallese
U.S. Virgin Islanders
5.7%
MALE UNEMPLOYMENT
0.5/ 100
METRIC RATING
248th/ 347
METRIC RANK
6.4%
MALE UNEMPLOYMENT
0.0/ 100
METRIC RATING
290th/ 347
METRIC RANK
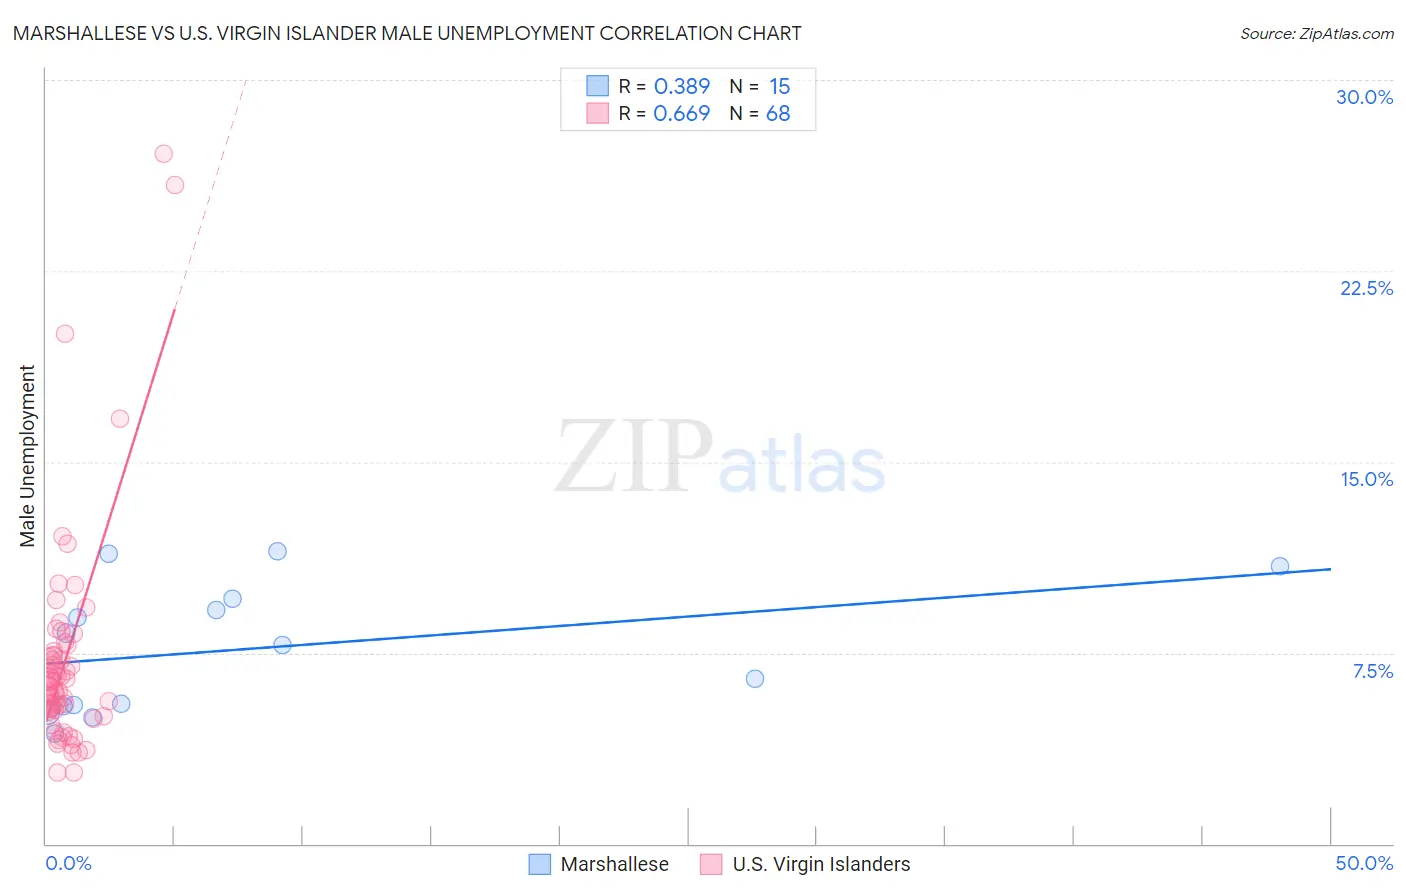
Marshallese vs U.S. Virgin Islander Male Unemployment Correlation Chart
The statistical analysis conducted on geographies consisting of 14,739,077 people shows a mild positive correlation between the proportion of Marshallese and unemployment rate among males in the United States with a correlation coefficient (R) of 0.389 and weighted average of 5.7%. Similarly, the statistical analysis conducted on geographies consisting of 87,502,390 people shows a significant positive correlation between the proportion of U.S. Virgin Islanders and unemployment rate among males in the United States with a correlation coefficient (R) of 0.669 and weighted average of 6.4%, a difference of 11.7%.
Male Unemployment Correlation Summary
| Measurement | Marshallese | U.S. Virgin Islander |
| Minimum | 4.3% | 2.8% |
| Maximum | 11.5% | 27.1% |
| Range | 7.1% | 24.3% |
| Mean | 7.7% | 7.2% |
| Median | 7.8% | 6.3% |
| Interquartile 25% (IQ1) | 5.4% | 5.2% |
| Interquartile 75% (IQ3) | 9.6% | 7.5% |
| Interquartile Range (IQR) | 4.2% | 2.3% |
| Standard Deviation (Sample) | 2.5% | 4.4% |
| Standard Deviation (Population) | 2.4% | 4.4% |
Similar Demographics by Male Unemployment
Demographics Similar to Marshallese by Male Unemployment
In terms of male unemployment, the demographic groups most similar to Marshallese are Cree (5.7%, a difference of 0.070%), Immigrants from Bahamas (5.7%, a difference of 0.31%), Hawaiian (5.7%, a difference of 0.32%), Spanish American (5.7%, a difference of 0.36%), and Iroquois (5.7%, a difference of 0.41%).
| Demographics | Rating | Rank | Male Unemployment |
| Salvadorans | 1.0 /100 | #241 | Tragic 5.7% |
| Ottawa | 0.9 /100 | #242 | Tragic 5.7% |
| Bangladeshis | 0.8 /100 | #243 | Tragic 5.7% |
| Immigrants | El Salvador | 0.7 /100 | #244 | Tragic 5.7% |
| Yaqui | 0.7 /100 | #245 | Tragic 5.7% |
| Iroquois | 0.6 /100 | #246 | Tragic 5.7% |
| Hawaiians | 0.6 /100 | #247 | Tragic 5.7% |
| Marshallese | 0.5 /100 | #248 | Tragic 5.7% |
| Cree | 0.4 /100 | #249 | Tragic 5.7% |
| Immigrants | Bahamas | 0.4 /100 | #250 | Tragic 5.7% |
| Spanish Americans | 0.3 /100 | #251 | Tragic 5.7% |
| Mexicans | 0.2 /100 | #252 | Tragic 5.8% |
| Mexican American Indians | 0.2 /100 | #253 | Tragic 5.8% |
| Japanese | 0.2 /100 | #254 | Tragic 5.8% |
| Kiowa | 0.2 /100 | #255 | Tragic 5.8% |
Demographics Similar to U.S. Virgin Islanders by Male Unemployment
In terms of male unemployment, the demographic groups most similar to U.S. Virgin Islanders are Immigrants from the Azores (6.4%, a difference of 0.52%), Nepalese (6.4%, a difference of 0.87%), Haitian (6.4%, a difference of 0.90%), Senegalese (6.4%, a difference of 1.0%), and Immigrants from Caribbean (6.3%, a difference of 1.6%).
| Demographics | Rating | Rank | Male Unemployment |
| Immigrants | Western Africa | 0.0 /100 | #283 | Tragic 6.2% |
| Spanish American Indians | 0.0 /100 | #284 | Tragic 6.2% |
| Immigrants | Ecuador | 0.0 /100 | #285 | Tragic 6.2% |
| Africans | 0.0 /100 | #286 | Tragic 6.3% |
| Central American Indians | 0.0 /100 | #287 | Tragic 6.3% |
| Immigrants | Senegal | 0.0 /100 | #288 | Tragic 6.3% |
| Immigrants | Caribbean | 0.0 /100 | #289 | Tragic 6.3% |
| U.S. Virgin Islanders | 0.0 /100 | #290 | Tragic 6.4% |
| Immigrants | Azores | 0.0 /100 | #291 | Tragic 6.4% |
| Nepalese | 0.0 /100 | #292 | Tragic 6.4% |
| Haitians | 0.0 /100 | #293 | Tragic 6.4% |
| Senegalese | 0.0 /100 | #294 | Tragic 6.4% |
| Belizeans | 0.0 /100 | #295 | Tragic 6.5% |
| Immigrants | Haiti | 0.0 /100 | #296 | Tragic 6.5% |
| Chippewa | 0.0 /100 | #297 | Tragic 6.6% |