Menominee vs U.S. Virgin Islander Male Unemployment
COMPARE
Menominee
U.S. Virgin Islander
Male Unemployment
Male Unemployment Comparison
Menominee
U.S. Virgin Islanders
6.0%
MALE UNEMPLOYMENT
0.0/ 100
METRIC RATING
275th/ 347
METRIC RANK
6.4%
MALE UNEMPLOYMENT
0.0/ 100
METRIC RATING
290th/ 347
METRIC RANK
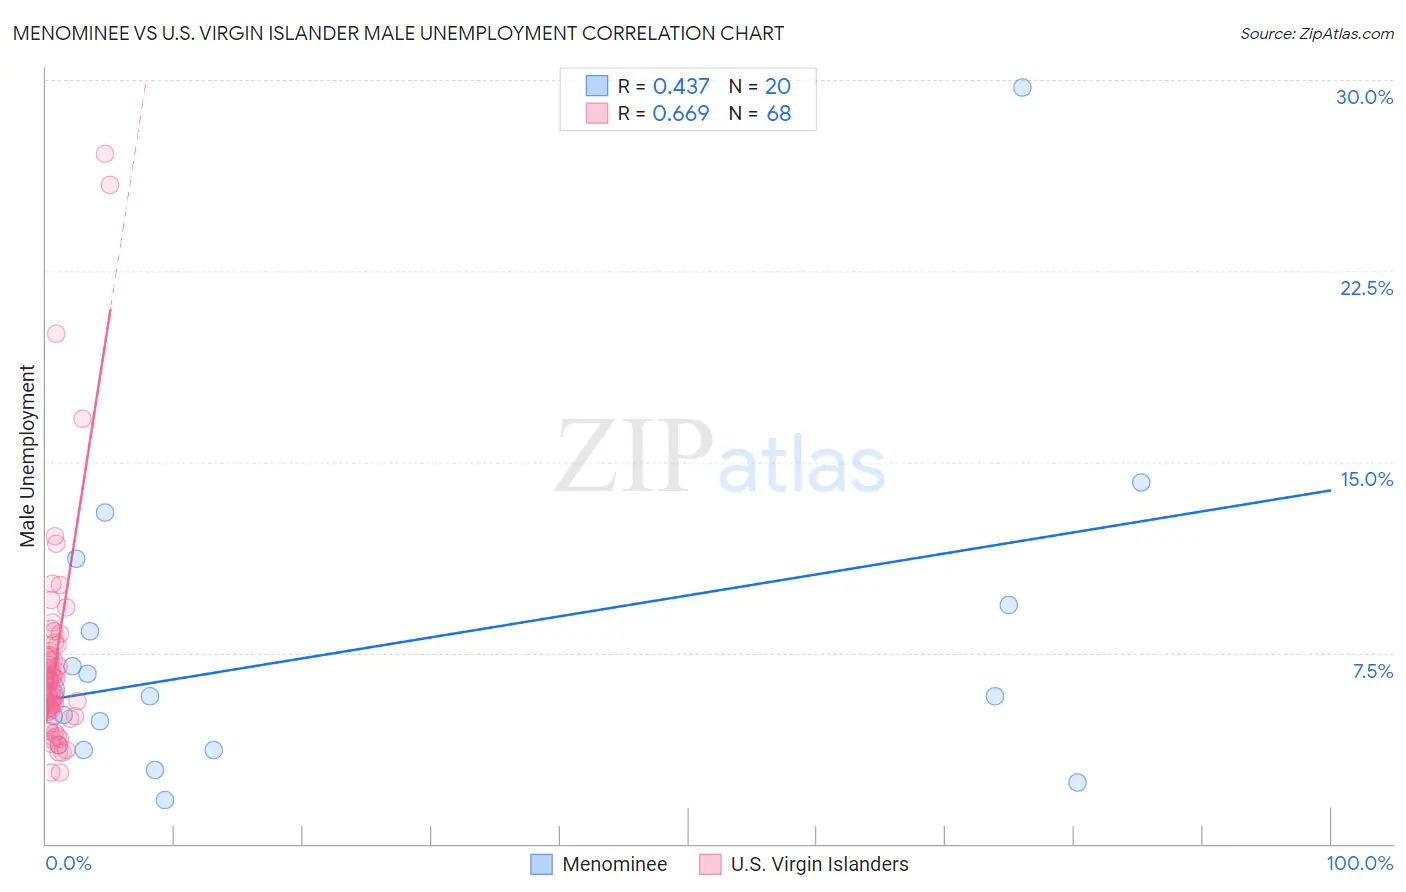
Menominee vs U.S. Virgin Islander Male Unemployment Correlation Chart
The statistical analysis conducted on geographies consisting of 45,696,214 people shows a moderate positive correlation between the proportion of Menominee and unemployment rate among males in the United States with a correlation coefficient (R) of 0.437 and weighted average of 6.0%. Similarly, the statistical analysis conducted on geographies consisting of 87,502,390 people shows a significant positive correlation between the proportion of U.S. Virgin Islanders and unemployment rate among males in the United States with a correlation coefficient (R) of 0.669 and weighted average of 6.4%, a difference of 5.9%.
Male Unemployment Correlation Summary
| Measurement | Menominee | U.S. Virgin Islander |
| Minimum | 1.7% | 2.8% |
| Maximum | 29.7% | 27.1% |
| Range | 28.0% | 24.3% |
| Mean | 7.5% | 7.2% |
| Median | 5.8% | 6.3% |
| Interquartile 25% (IQ1) | 3.8% | 5.2% |
| Interquartile 75% (IQ3) | 8.9% | 7.5% |
| Interquartile Range (IQR) | 5.1% | 2.3% |
| Standard Deviation (Sample) | 6.2% | 4.4% |
| Standard Deviation (Population) | 6.1% | 4.4% |
Demographics Similar to Menominee and U.S. Virgin Islanders by Male Unemployment
In terms of male unemployment, the demographic groups most similar to Menominee are Tlingit-Haida (6.0%, a difference of 0.10%), Immigrants from Sierra Leone (6.0%, a difference of 0.15%), Armenian (6.0%, a difference of 0.33%), Immigrants from Uzbekistan (6.0%, a difference of 0.34%), and Immigrants from Liberia (6.1%, a difference of 0.52%). Similarly, the demographic groups most similar to U.S. Virgin Islanders are Immigrants from the Azores (6.4%, a difference of 0.52%), Nepalese (6.4%, a difference of 0.87%), Immigrants from Caribbean (6.3%, a difference of 1.6%), Immigrants from Senegal (6.3%, a difference of 1.7%), and Central American Indian (6.3%, a difference of 1.7%).
| Demographics | Rating | Rank | Male Unemployment |
| Immigrants | Uzbekistan | 0.0 /100 | #272 | Tragic 6.0% |
| Armenians | 0.0 /100 | #273 | Tragic 6.0% |
| Immigrants | Sierra Leone | 0.0 /100 | #274 | Tragic 6.0% |
| Menominee | 0.0 /100 | #275 | Tragic 6.0% |
| Tlingit-Haida | 0.0 /100 | #276 | Tragic 6.0% |
| Immigrants | Liberia | 0.0 /100 | #277 | Tragic 6.1% |
| Immigrants | Fiji | 0.0 /100 | #278 | Tragic 6.1% |
| Ghanaians | 0.0 /100 | #279 | Tragic 6.1% |
| Immigrants | Ghana | 0.0 /100 | #280 | Tragic 6.2% |
| Sierra Leoneans | 0.0 /100 | #281 | Tragic 6.2% |
| Ecuadorians | 0.0 /100 | #282 | Tragic 6.2% |
| Immigrants | Western Africa | 0.0 /100 | #283 | Tragic 6.2% |
| Spanish American Indians | 0.0 /100 | #284 | Tragic 6.2% |
| Immigrants | Ecuador | 0.0 /100 | #285 | Tragic 6.2% |
| Africans | 0.0 /100 | #286 | Tragic 6.3% |
| Central American Indians | 0.0 /100 | #287 | Tragic 6.3% |
| Immigrants | Senegal | 0.0 /100 | #288 | Tragic 6.3% |
| Immigrants | Caribbean | 0.0 /100 | #289 | Tragic 6.3% |
| U.S. Virgin Islanders | 0.0 /100 | #290 | Tragic 6.4% |
| Immigrants | Azores | 0.0 /100 | #291 | Tragic 6.4% |
| Nepalese | 0.0 /100 | #292 | Tragic 6.4% |