Creek vs Immigrants from Ethiopia Male Unemployment
COMPARE
Creek
Immigrants from Ethiopia
Male Unemployment
Male Unemployment Comparison
Creek
Immigrants from Ethiopia
5.6%
MALE UNEMPLOYMENT
2.6/ 100
METRIC RATING
223rd/ 347
METRIC RANK
5.1%
MALE UNEMPLOYMENT
91.5/ 100
METRIC RATING
106th/ 347
METRIC RANK
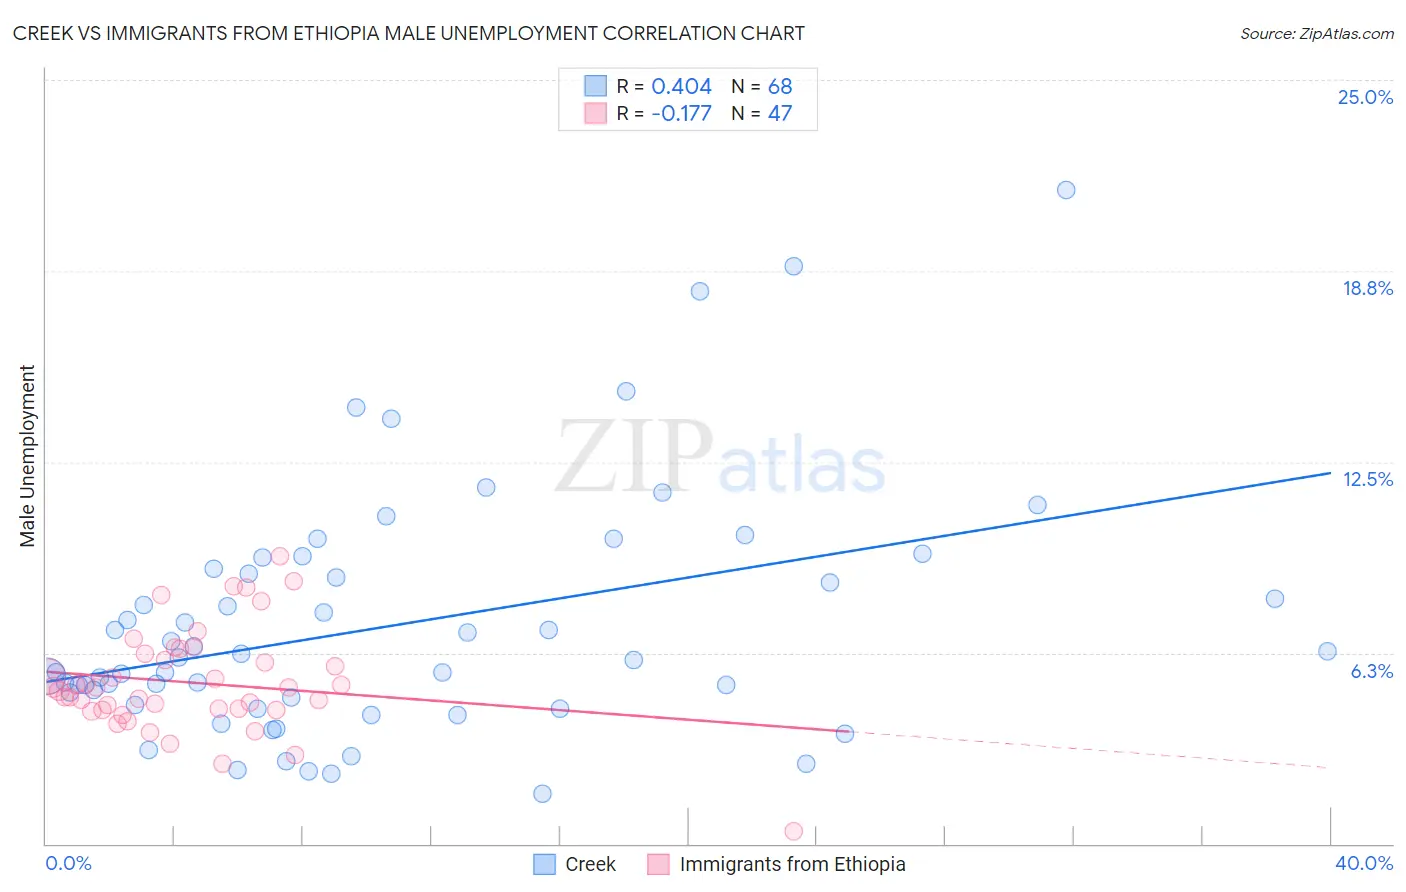
Creek vs Immigrants from Ethiopia Male Unemployment Correlation Chart
The statistical analysis conducted on geographies consisting of 177,831,732 people shows a moderate positive correlation between the proportion of Creek and unemployment rate among males in the United States with a correlation coefficient (R) of 0.404 and weighted average of 5.6%. Similarly, the statistical analysis conducted on geographies consisting of 211,215,885 people shows a poor negative correlation between the proportion of Immigrants from Ethiopia and unemployment rate among males in the United States with a correlation coefficient (R) of -0.177 and weighted average of 5.1%, a difference of 9.1%.
Male Unemployment Correlation Summary
| Measurement | Creek | Immigrants from Ethiopia |
| Minimum | 1.6% | 0.40% |
| Maximum | 21.4% | 9.4% |
| Range | 19.8% | 9.0% |
| Mean | 7.1% | 5.3% |
| Median | 6.1% | 5.1% |
| Interquartile 25% (IQ1) | 4.7% | 4.4% |
| Interquartile 75% (IQ3) | 8.9% | 6.2% |
| Interquartile Range (IQR) | 4.3% | 1.8% |
| Standard Deviation (Sample) | 4.0% | 1.7% |
| Standard Deviation (Population) | 3.9% | 1.7% |
Similar Demographics by Male Unemployment
Demographics Similar to Creek by Male Unemployment
In terms of male unemployment, the demographic groups most similar to Creek are Cherokee (5.6%, a difference of 0.13%), Immigrants from Micronesia (5.6%, a difference of 0.15%), Soviet Union (5.6%, a difference of 0.29%), Portuguese (5.6%, a difference of 0.40%), and Immigrants from Western Asia (5.6%, a difference of 0.42%).
| Demographics | Rating | Rank | Male Unemployment |
| Immigrants | Immigrants | 4.3 /100 | #216 | Tragic 5.5% |
| Delaware | 4.2 /100 | #217 | Tragic 5.5% |
| Immigrants | Albania | 3.6 /100 | #218 | Tragic 5.5% |
| Immigrants | Western Asia | 3.5 /100 | #219 | Tragic 5.6% |
| Portuguese | 3.5 /100 | #220 | Tragic 5.6% |
| Soviet Union | 3.2 /100 | #221 | Tragic 5.6% |
| Immigrants | Micronesia | 2.9 /100 | #222 | Tragic 5.6% |
| Creek | 2.6 /100 | #223 | Tragic 5.6% |
| Cherokee | 2.4 /100 | #224 | Tragic 5.6% |
| Panamanians | 1.9 /100 | #225 | Tragic 5.6% |
| Immigrants | Cambodia | 1.8 /100 | #226 | Tragic 5.6% |
| Immigrants | Panama | 1.8 /100 | #227 | Tragic 5.6% |
| Seminole | 1.8 /100 | #228 | Tragic 5.6% |
| Central Americans | 1.8 /100 | #229 | Tragic 5.6% |
| Immigrants | Africa | 1.7 /100 | #230 | Tragic 5.6% |
Demographics Similar to Immigrants from Ethiopia by Male Unemployment
In terms of male unemployment, the demographic groups most similar to Immigrants from Ethiopia are Immigrants from Czechoslovakia (5.1%, a difference of 0.040%), Ethiopian (5.1%, a difference of 0.040%), Immigrants from Chile (5.1%, a difference of 0.050%), Immigrants from Nicaragua (5.1%, a difference of 0.050%), and Immigrants from Jordan (5.1%, a difference of 0.080%).
| Demographics | Rating | Rank | Male Unemployment |
| Uruguayans | 93.0 /100 | #99 | Exceptional 5.1% |
| Russians | 92.9 /100 | #100 | Exceptional 5.1% |
| German Russians | 92.7 /100 | #101 | Exceptional 5.1% |
| Immigrants | France | 92.7 /100 | #102 | Exceptional 5.1% |
| Immigrants | Jordan | 91.9 /100 | #103 | Exceptional 5.1% |
| Immigrants | Chile | 91.8 /100 | #104 | Exceptional 5.1% |
| Immigrants | Czechoslovakia | 91.7 /100 | #105 | Exceptional 5.1% |
| Immigrants | Ethiopia | 91.5 /100 | #106 | Exceptional 5.1% |
| Ethiopians | 91.3 /100 | #107 | Exceptional 5.1% |
| Immigrants | Nicaragua | 91.2 /100 | #108 | Exceptional 5.1% |
| Immigrants | Pakistan | 90.9 /100 | #109 | Exceptional 5.1% |
| Immigrants | England | 90.8 /100 | #110 | Exceptional 5.1% |
| Immigrants | Eastern Asia | 90.8 /100 | #111 | Exceptional 5.1% |
| Immigrants | Moldova | 90.3 /100 | #112 | Exceptional 5.1% |
| Immigrants | Austria | 90.3 /100 | #113 | Exceptional 5.1% |