Creek vs Immigrants from Latin America Male Unemployment
COMPARE
Creek
Immigrants from Latin America
Male Unemployment
Male Unemployment Comparison
Creek
Immigrants from Latin America
5.6%
MALE UNEMPLOYMENT
2.6/ 100
METRIC RATING
223rd/ 347
METRIC RANK
5.9%
MALE UNEMPLOYMENT
0.1/ 100
METRIC RATING
263rd/ 347
METRIC RANK
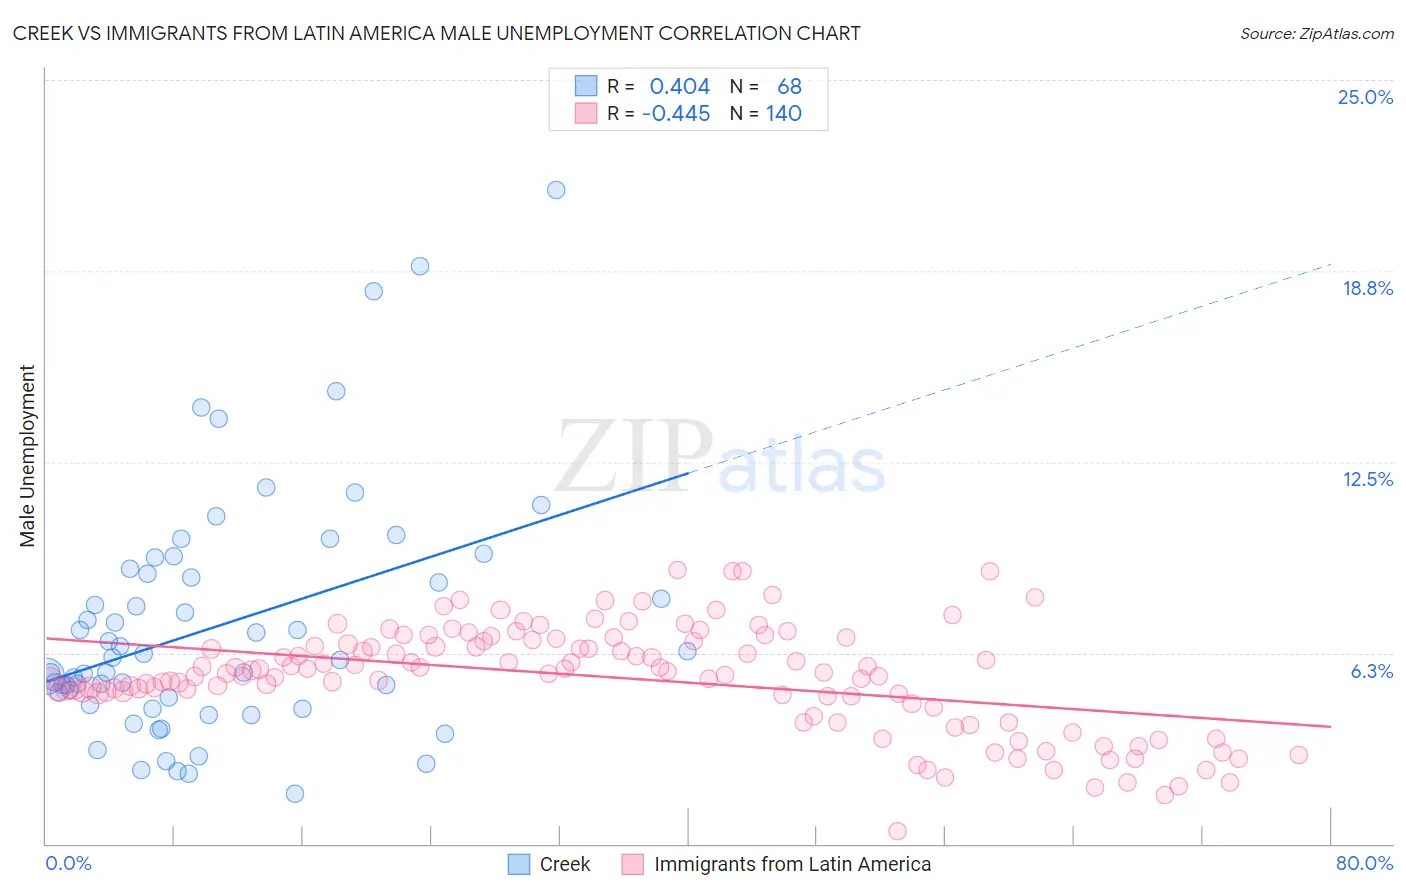
Creek vs Immigrants from Latin America Male Unemployment Correlation Chart
The statistical analysis conducted on geographies consisting of 177,831,732 people shows a moderate positive correlation between the proportion of Creek and unemployment rate among males in the United States with a correlation coefficient (R) of 0.404 and weighted average of 5.6%. Similarly, the statistical analysis conducted on geographies consisting of 550,432,007 people shows a moderate negative correlation between the proportion of Immigrants from Latin America and unemployment rate among males in the United States with a correlation coefficient (R) of -0.445 and weighted average of 5.9%, a difference of 5.4%.
Male Unemployment Correlation Summary
| Measurement | Creek | Immigrants from Latin America |
| Minimum | 1.6% | 0.40% |
| Maximum | 21.4% | 9.0% |
| Range | 19.8% | 8.6% |
| Mean | 7.1% | 5.4% |
| Median | 6.1% | 5.6% |
| Interquartile 25% (IQ1) | 4.7% | 4.8% |
| Interquartile 75% (IQ3) | 8.9% | 6.6% |
| Interquartile Range (IQR) | 4.3% | 1.8% |
| Standard Deviation (Sample) | 4.0% | 1.7% |
| Standard Deviation (Population) | 3.9% | 1.7% |
Similar Demographics by Male Unemployment
Demographics Similar to Creek by Male Unemployment
In terms of male unemployment, the demographic groups most similar to Creek are Cherokee (5.6%, a difference of 0.13%), Immigrants from Micronesia (5.6%, a difference of 0.15%), Soviet Union (5.6%, a difference of 0.29%), Portuguese (5.6%, a difference of 0.40%), and Immigrants from Western Asia (5.6%, a difference of 0.42%).
| Demographics | Rating | Rank | Male Unemployment |
| Immigrants | Immigrants | 4.3 /100 | #216 | Tragic 5.5% |
| Delaware | 4.2 /100 | #217 | Tragic 5.5% |
| Immigrants | Albania | 3.6 /100 | #218 | Tragic 5.5% |
| Immigrants | Western Asia | 3.5 /100 | #219 | Tragic 5.6% |
| Portuguese | 3.5 /100 | #220 | Tragic 5.6% |
| Soviet Union | 3.2 /100 | #221 | Tragic 5.6% |
| Immigrants | Micronesia | 2.9 /100 | #222 | Tragic 5.6% |
| Creek | 2.6 /100 | #223 | Tragic 5.6% |
| Cherokee | 2.4 /100 | #224 | Tragic 5.6% |
| Panamanians | 1.9 /100 | #225 | Tragic 5.6% |
| Immigrants | Cambodia | 1.8 /100 | #226 | Tragic 5.6% |
| Immigrants | Panama | 1.8 /100 | #227 | Tragic 5.6% |
| Seminole | 1.8 /100 | #228 | Tragic 5.6% |
| Central Americans | 1.8 /100 | #229 | Tragic 5.6% |
| Immigrants | Africa | 1.7 /100 | #230 | Tragic 5.6% |
Demographics Similar to Immigrants from Latin America by Male Unemployment
In terms of male unemployment, the demographic groups most similar to Immigrants from Latin America are Immigrants from Mexico (5.9%, a difference of 0.22%), Immigrants from Portugal (5.9%, a difference of 0.24%), French American Indian (5.9%, a difference of 0.61%), Liberian (5.8%, a difference of 0.69%), and Bahamian (5.9%, a difference of 0.75%).
| Demographics | Rating | Rank | Male Unemployment |
| Comanche | 0.2 /100 | #256 | Tragic 5.8% |
| Hispanics or Latinos | 0.1 /100 | #257 | Tragic 5.8% |
| Dutch West Indians | 0.1 /100 | #258 | Tragic 5.8% |
| Cajuns | 0.1 /100 | #259 | Tragic 5.8% |
| Immigrants | Central America | 0.1 /100 | #260 | Tragic 5.8% |
| Liberians | 0.1 /100 | #261 | Tragic 5.8% |
| Immigrants | Portugal | 0.1 /100 | #262 | Tragic 5.9% |
| Immigrants | Latin America | 0.1 /100 | #263 | Tragic 5.9% |
| Immigrants | Mexico | 0.0 /100 | #264 | Tragic 5.9% |
| French American Indians | 0.0 /100 | #265 | Tragic 5.9% |
| Bahamians | 0.0 /100 | #266 | Tragic 5.9% |
| Nigerians | 0.0 /100 | #267 | Tragic 5.9% |
| Bermudans | 0.0 /100 | #268 | Tragic 5.9% |
| Immigrants | Nigeria | 0.0 /100 | #269 | Tragic 6.0% |
| Sub-Saharan Africans | 0.0 /100 | #270 | Tragic 6.0% |