Chippewa vs Australian Unemployment Among Ages 20 to 24 years
COMPARE
Chippewa
Australian
Unemployment Among Ages 20 to 24 years
Unemployment Among Ages 20 to 24 years Comparison
Chippewa
Australians
12.3%
UNEMPLOYMENT AMONG AGES 20 TO 24 YEARS
0.0/ 100
METRIC RATING
305th/ 347
METRIC RANK
9.6%
UNEMPLOYMENT AMONG AGES 20 TO 24 YEARS
100.0/ 100
METRIC RATING
33rd/ 347
METRIC RANK
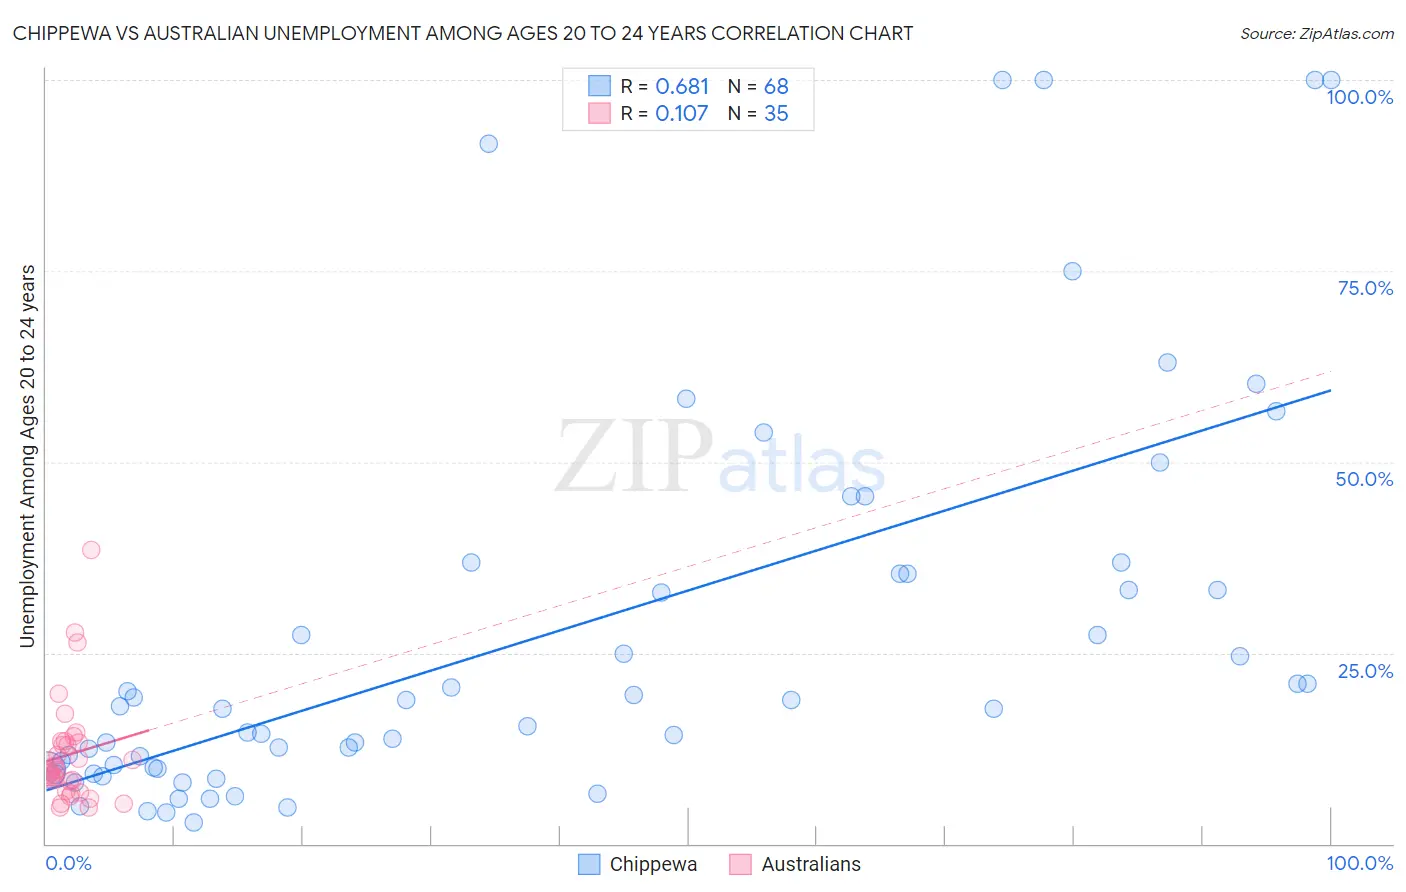
Chippewa vs Australian Unemployment Among Ages 20 to 24 years Correlation Chart
The statistical analysis conducted on geographies consisting of 208,606,929 people shows a significant positive correlation between the proportion of Chippewa and unemployment rate among population between the ages 20 and 24 in the United States with a correlation coefficient (R) of 0.681 and weighted average of 12.3%. Similarly, the statistical analysis conducted on geographies consisting of 219,577,245 people shows a poor positive correlation between the proportion of Australians and unemployment rate among population between the ages 20 and 24 in the United States with a correlation coefficient (R) of 0.107 and weighted average of 9.6%, a difference of 28.7%.
Unemployment Among Ages 20 to 24 years Correlation Summary
| Measurement | Chippewa | Australian |
| Minimum | 2.8% | 4.7% |
| Maximum | 100.0% | 38.5% |
| Range | 97.2% | 33.8% |
| Mean | 27.4% | 11.7% |
| Median | 17.8% | 9.6% |
| Interquartile 25% (IQ1) | 9.9% | 6.9% |
| Interquartile 75% (IQ3) | 35.4% | 13.4% |
| Interquartile Range (IQR) | 25.5% | 6.5% |
| Standard Deviation (Sample) | 26.0% | 7.1% |
| Standard Deviation (Population) | 25.8% | 7.0% |
Similar Demographics by Unemployment Among Ages 20 to 24 years
Demographics Similar to Chippewa by Unemployment Among Ages 20 to 24 years
In terms of unemployment among ages 20 to 24 years, the demographic groups most similar to Chippewa are Immigrants from West Indies (12.3%, a difference of 0.040%), Haitian (12.2%, a difference of 0.64%), Immigrants from Cabo Verde (12.2%, a difference of 0.65%), Immigrants from Haiti (12.4%, a difference of 0.84%), and Bermudan (12.5%, a difference of 1.3%).
| Demographics | Rating | Rank | Unemployment Among Ages 20 to 24 years |
| Lumbee | 0.0 /100 | #298 | Tragic 12.0% |
| Apache | 0.0 /100 | #299 | Tragic 12.0% |
| Spanish American Indians | 0.0 /100 | #300 | Tragic 12.1% |
| Immigrants | Sierra Leone | 0.0 /100 | #301 | Tragic 12.1% |
| Immigrants | Cabo Verde | 0.0 /100 | #302 | Tragic 12.2% |
| Haitians | 0.0 /100 | #303 | Tragic 12.2% |
| Immigrants | West Indies | 0.0 /100 | #304 | Tragic 12.3% |
| Chippewa | 0.0 /100 | #305 | Tragic 12.3% |
| Immigrants | Haiti | 0.0 /100 | #306 | Tragic 12.4% |
| Bermudans | 0.0 /100 | #307 | Tragic 12.5% |
| Tohono O'odham | 0.0 /100 | #308 | Tragic 12.5% |
| Immigrants | Bangladesh | 0.0 /100 | #309 | Tragic 12.6% |
| Jamaicans | 0.0 /100 | #310 | Tragic 12.6% |
| Vietnamese | 0.0 /100 | #311 | Tragic 12.6% |
| Houma | 0.0 /100 | #312 | Tragic 12.6% |
Demographics Similar to Australians by Unemployment Among Ages 20 to 24 years
In terms of unemployment among ages 20 to 24 years, the demographic groups most similar to Australians are Cambodian (9.5%, a difference of 0.11%), Immigrants from Eastern Africa (9.5%, a difference of 0.16%), Yugoslavian (9.6%, a difference of 0.20%), Scandinavian (9.5%, a difference of 0.24%), and Immigrants from North Macedonia (9.5%, a difference of 0.26%).
| Demographics | Rating | Rank | Unemployment Among Ages 20 to 24 years |
| Swedes | 100.0 /100 | #26 | Exceptional 9.5% |
| Immigrants | Zimbabwe | 100.0 /100 | #27 | Exceptional 9.5% |
| Immigrants | Afghanistan | 100.0 /100 | #28 | Exceptional 9.5% |
| Immigrants | North Macedonia | 100.0 /100 | #29 | Exceptional 9.5% |
| Scandinavians | 100.0 /100 | #30 | Exceptional 9.5% |
| Immigrants | Eastern Africa | 100.0 /100 | #31 | Exceptional 9.5% |
| Cambodians | 100.0 /100 | #32 | Exceptional 9.5% |
| Australians | 100.0 /100 | #33 | Exceptional 9.6% |
| Yugoslavians | 100.0 /100 | #34 | Exceptional 9.6% |
| Germans | 100.0 /100 | #35 | Exceptional 9.6% |
| Belgians | 100.0 /100 | #36 | Exceptional 9.6% |
| Immigrants | Zaire | 100.0 /100 | #37 | Exceptional 9.6% |
| Afghans | 99.9 /100 | #38 | Exceptional 9.6% |
| Dutch | 99.9 /100 | #39 | Exceptional 9.6% |
| Immigrants | Ethiopia | 99.9 /100 | #40 | Exceptional 9.6% |