Chickasaw vs British West Indian Householder Income Ages 25 - 44 years
COMPARE
Chickasaw
British West Indian
Householder Income Ages 25 - 44 years
Householder Income Ages 25 - 44 years Comparison
Chickasaw
British West Indians
$77,929
HOUSEHOLDER INCOME AGES 25 - 44 YEARS
0.0/ 100
METRIC RATING
322nd/ 347
METRIC RANK
$85,565
HOUSEHOLDER INCOME AGES 25 - 44 YEARS
0.7/ 100
METRIC RATING
253rd/ 347
METRIC RANK
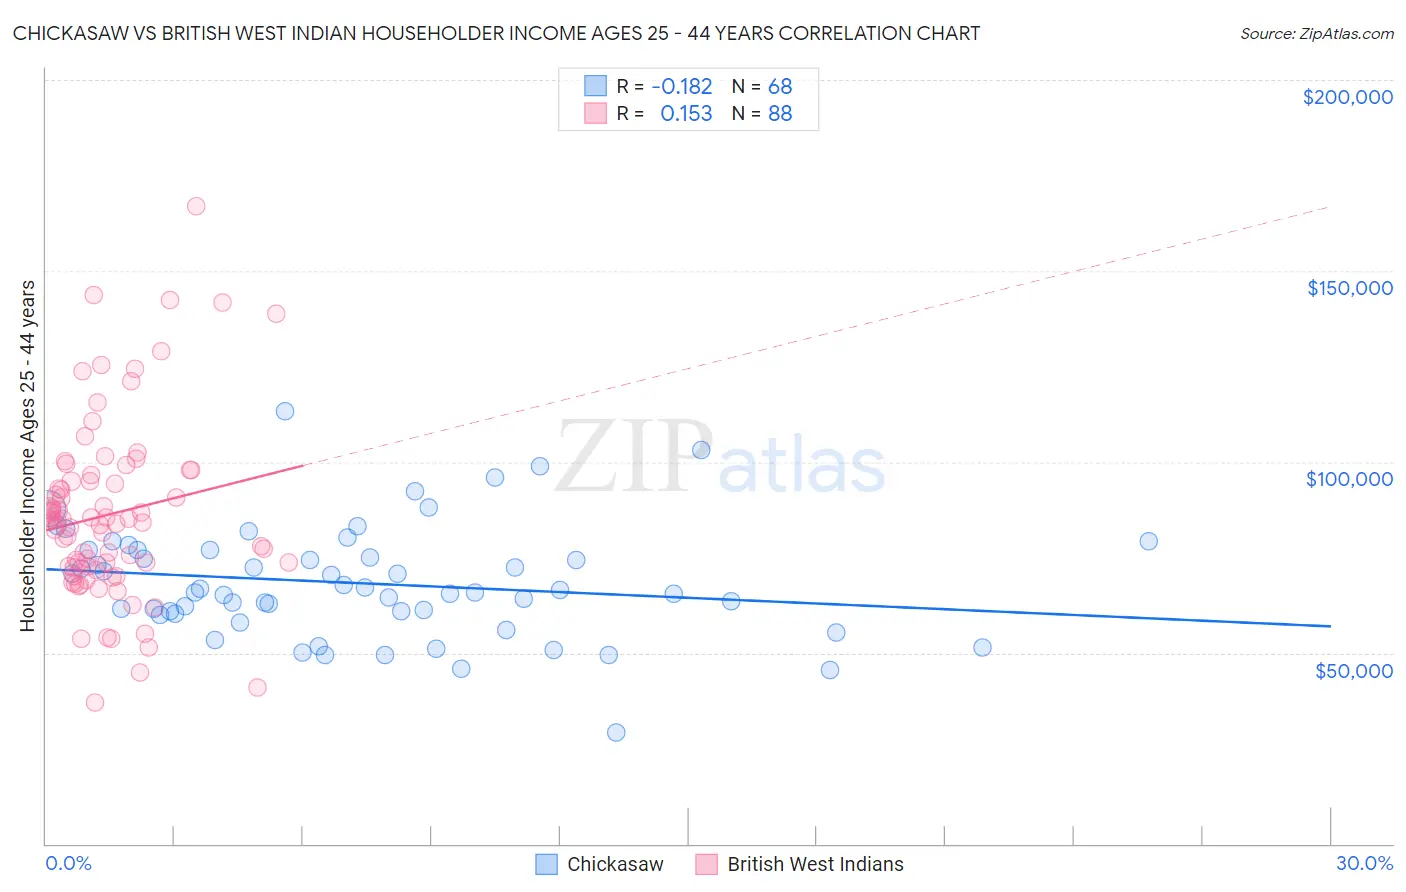
Chickasaw vs British West Indian Householder Income Ages 25 - 44 years Correlation Chart
The statistical analysis conducted on geographies consisting of 147,542,278 people shows a poor negative correlation between the proportion of Chickasaw and household income with householder between the ages 25 and 44 in the United States with a correlation coefficient (R) of -0.182 and weighted average of $77,929. Similarly, the statistical analysis conducted on geographies consisting of 152,560,295 people shows a poor positive correlation between the proportion of British West Indians and household income with householder between the ages 25 and 44 in the United States with a correlation coefficient (R) of 0.153 and weighted average of $85,565, a difference of 9.8%.
Householder Income Ages 25 - 44 years Correlation Summary
| Measurement | Chickasaw | British West Indian |
| Minimum | $29,071 | $36,830 |
| Maximum | $113,361 | $167,054 |
| Range | $84,290 | $130,224 |
| Mean | $68,238 | $86,302 |
| Median | $66,121 | $84,792 |
| Interquartile 25% (IQ1) | $60,623 | $72,493 |
| Interquartile 75% (IQ3) | $76,882 | $95,723 |
| Interquartile Range (IQR) | $16,259 | $23,230 |
| Standard Deviation (Sample) | $14,676 | $23,581 |
| Standard Deviation (Population) | $14,567 | $23,446 |
Similar Demographics by Householder Income Ages 25 - 44 years
Demographics Similar to Chickasaw by Householder Income Ages 25 - 44 years
In terms of householder income ages 25 - 44 years, the demographic groups most similar to Chickasaw are Immigrants from Zaire ($78,045, a difference of 0.15%), Choctaw ($78,168, a difference of 0.31%), Honduran ($78,540, a difference of 0.78%), Immigrants from Honduras ($77,328, a difference of 0.78%), and Dutch West Indian ($77,260, a difference of 0.87%).
| Demographics | Rating | Rank | Householder Income Ages 25 - 44 years |
| Ottawa | 0.0 /100 | #315 | Tragic $79,012 |
| Africans | 0.0 /100 | #316 | Tragic $78,986 |
| U.S. Virgin Islanders | 0.0 /100 | #317 | Tragic $78,911 |
| Immigrants | Mexico | 0.0 /100 | #318 | Tragic $78,809 |
| Hondurans | 0.0 /100 | #319 | Tragic $78,540 |
| Choctaw | 0.0 /100 | #320 | Tragic $78,168 |
| Immigrants | Zaire | 0.0 /100 | #321 | Tragic $78,045 |
| Chickasaw | 0.0 /100 | #322 | Tragic $77,929 |
| Immigrants | Honduras | 0.0 /100 | #323 | Tragic $77,328 |
| Dutch West Indians | 0.0 /100 | #324 | Tragic $77,260 |
| Sioux | 0.0 /100 | #325 | Tragic $77,089 |
| Houma | 0.0 /100 | #326 | Tragic $77,044 |
| Immigrants | Bahamas | 0.0 /100 | #327 | Tragic $76,910 |
| Immigrants | Cuba | 0.0 /100 | #328 | Tragic $76,701 |
| Seminole | 0.0 /100 | #329 | Tragic $76,584 |
Demographics Similar to British West Indians by Householder Income Ages 25 - 44 years
In terms of householder income ages 25 - 44 years, the demographic groups most similar to British West Indians are Immigrants from Laos ($85,553, a difference of 0.010%), Immigrants from Western Africa ($85,676, a difference of 0.13%), Cape Verdean ($85,758, a difference of 0.23%), Pennsylvania German ($85,836, a difference of 0.32%), and French American Indian ($85,899, a difference of 0.39%).
| Demographics | Rating | Rank | Householder Income Ages 25 - 44 years |
| Immigrants | Burma/Myanmar | 1.3 /100 | #246 | Tragic $86,736 |
| Immigrants | Nigeria | 1.2 /100 | #247 | Tragic $86,589 |
| Immigrants | Sudan | 0.9 /100 | #248 | Tragic $86,109 |
| French American Indians | 0.8 /100 | #249 | Tragic $85,899 |
| Pennsylvania Germans | 0.8 /100 | #250 | Tragic $85,836 |
| Cape Verdeans | 0.8 /100 | #251 | Tragic $85,758 |
| Immigrants | Western Africa | 0.7 /100 | #252 | Tragic $85,676 |
| British West Indians | 0.7 /100 | #253 | Tragic $85,565 |
| Immigrants | Laos | 0.7 /100 | #254 | Tragic $85,553 |
| German Russians | 0.6 /100 | #255 | Tragic $85,220 |
| Central Americans | 0.5 /100 | #256 | Tragic $85,144 |
| Mexican American Indians | 0.5 /100 | #257 | Tragic $85,066 |
| Immigrants | Nicaragua | 0.5 /100 | #258 | Tragic $84,914 |
| Immigrants | Senegal | 0.5 /100 | #259 | Tragic $84,848 |
| Americans | 0.4 /100 | #260 | Tragic $84,791 |