British vs Immigrants from Mexico Female Unemployment
COMPARE
British
Immigrants from Mexico
Female Unemployment
Female Unemployment Comparison
British
Immigrants from Mexico
4.7%
FEMALE UNEMPLOYMENT
99.9/ 100
METRIC RATING
27th/ 347
METRIC RANK
6.3%
FEMALE UNEMPLOYMENT
0.0/ 100
METRIC RATING
311th/ 347
METRIC RANK
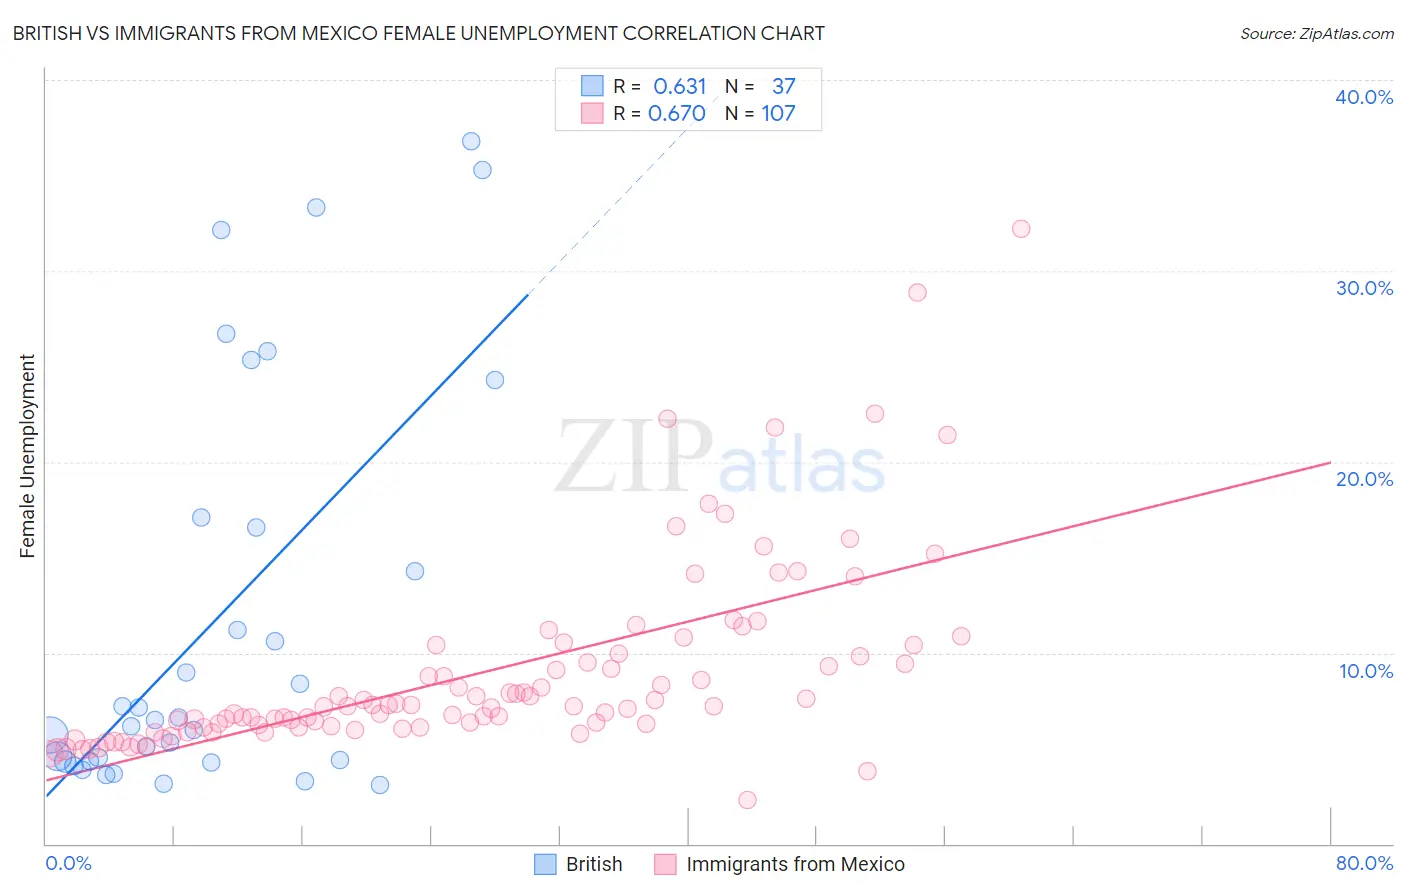
British vs Immigrants from Mexico Female Unemployment Correlation Chart
The statistical analysis conducted on geographies consisting of 523,107,564 people shows a significant positive correlation between the proportion of British and unemploymnet rate among females in the United States with a correlation coefficient (R) of 0.631 and weighted average of 4.7%. Similarly, the statistical analysis conducted on geographies consisting of 506,833,081 people shows a significant positive correlation between the proportion of Immigrants from Mexico and unemploymnet rate among females in the United States with a correlation coefficient (R) of 0.670 and weighted average of 6.3%, a difference of 33.0%.
Female Unemployment Correlation Summary
| Measurement | British | Immigrants from Mexico |
| Minimum | 3.1% | 2.3% |
| Maximum | 36.8% | 32.2% |
| Range | 33.7% | 29.9% |
| Mean | 11.7% | 9.0% |
| Median | 6.5% | 7.2% |
| Interquartile 25% (IQ1) | 4.3% | 6.1% |
| Interquartile 75% (IQ3) | 16.8% | 9.9% |
| Interquartile Range (IQR) | 12.5% | 3.8% |
| Standard Deviation (Sample) | 10.5% | 5.0% |
| Standard Deviation (Population) | 10.4% | 5.0% |
Similar Demographics by Female Unemployment
Demographics Similar to British by Female Unemployment
In terms of female unemployment, the demographic groups most similar to British are Irish (4.7%, a difference of 0.030%), Cypriot (4.7%, a difference of 0.040%), Lithuanian (4.7%, a difference of 0.16%), Immigrants from Bosnia and Herzegovina (4.7%, a difference of 0.17%), and Immigrants from India (4.7%, a difference of 0.20%).
| Demographics | Rating | Rank | Female Unemployment |
| Bulgarians | 99.9 /100 | #20 | Exceptional 4.7% |
| Fijians | 99.9 /100 | #21 | Exceptional 4.7% |
| Europeans | 99.9 /100 | #22 | Exceptional 4.7% |
| Scottish | 99.9 /100 | #23 | Exceptional 4.7% |
| Welsh | 99.9 /100 | #24 | Exceptional 4.7% |
| Immigrants | India | 99.9 /100 | #25 | Exceptional 4.7% |
| Immigrants | Bosnia and Herzegovina | 99.9 /100 | #26 | Exceptional 4.7% |
| British | 99.9 /100 | #27 | Exceptional 4.7% |
| Irish | 99.9 /100 | #28 | Exceptional 4.7% |
| Cypriots | 99.9 /100 | #29 | Exceptional 4.7% |
| Lithuanians | 99.8 /100 | #30 | Exceptional 4.7% |
| Sudanese | 99.8 /100 | #31 | Exceptional 4.8% |
| Slovaks | 99.8 /100 | #32 | Exceptional 4.8% |
| Czechoslovakians | 99.7 /100 | #33 | Exceptional 4.8% |
| Zimbabweans | 99.7 /100 | #34 | Exceptional 4.8% |
Demographics Similar to Immigrants from Mexico by Female Unemployment
In terms of female unemployment, the demographic groups most similar to Immigrants from Mexico are Central American Indian (6.3%, a difference of 0.13%), Ecuadorian (6.3%, a difference of 0.54%), Immigrants from Grenada (6.3%, a difference of 0.66%), Belizean (6.3%, a difference of 0.67%), and Immigrants from Ecuador (6.4%, a difference of 0.90%).
| Demographics | Rating | Rank | Female Unemployment |
| Immigrants | Jamaica | 0.0 /100 | #304 | Tragic 6.2% |
| Spanish American Indians | 0.0 /100 | #305 | Tragic 6.2% |
| Immigrants | Central America | 0.0 /100 | #306 | Tragic 6.2% |
| Shoshone | 0.0 /100 | #307 | Tragic 6.2% |
| Hispanics or Latinos | 0.0 /100 | #308 | Tragic 6.2% |
| Ecuadorians | 0.0 /100 | #309 | Tragic 6.3% |
| Central American Indians | 0.0 /100 | #310 | Tragic 6.3% |
| Immigrants | Mexico | 0.0 /100 | #311 | Tragic 6.3% |
| Immigrants | Grenada | 0.0 /100 | #312 | Tragic 6.3% |
| Belizeans | 0.0 /100 | #313 | Tragic 6.3% |
| Immigrants | Ecuador | 0.0 /100 | #314 | Tragic 6.4% |
| Pueblo | 0.0 /100 | #315 | Tragic 6.4% |
| Houma | 0.0 /100 | #316 | Tragic 6.4% |
| Immigrants | St. Vincent and the Grenadines | 0.0 /100 | #317 | Tragic 6.4% |
| British West Indians | 0.0 /100 | #318 | Tragic 6.4% |