British vs Yakama Female Unemployment
COMPARE
British
Yakama
Female Unemployment
Female Unemployment Comparison
British
Yakama
4.7%
FEMALE UNEMPLOYMENT
99.9/ 100
METRIC RATING
27th/ 347
METRIC RANK
6.7%
FEMALE UNEMPLOYMENT
0.0/ 100
METRIC RATING
330th/ 347
METRIC RANK
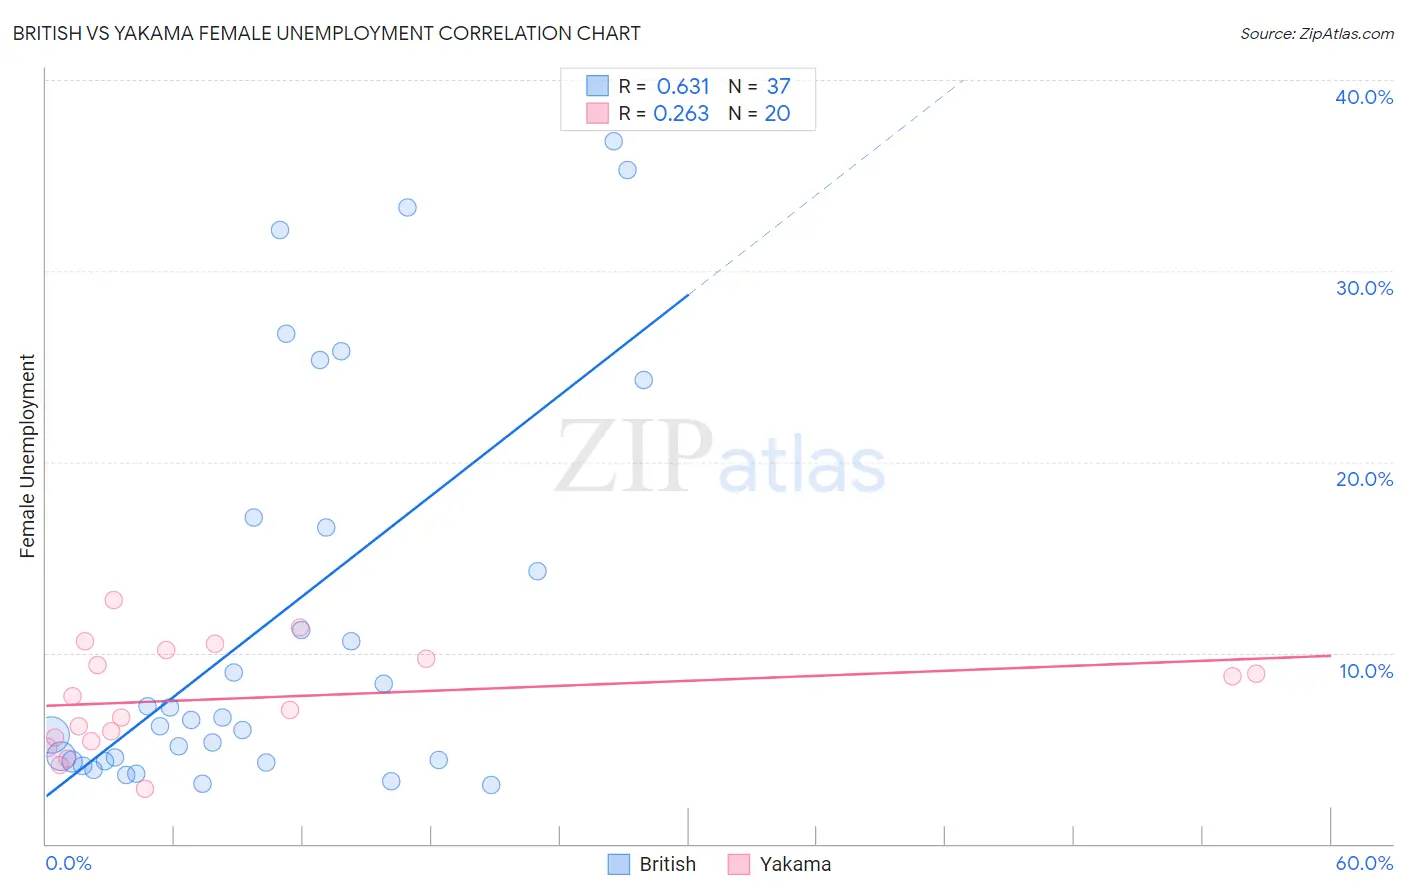
British vs Yakama Female Unemployment Correlation Chart
The statistical analysis conducted on geographies consisting of 523,107,564 people shows a significant positive correlation between the proportion of British and unemploymnet rate among females in the United States with a correlation coefficient (R) of 0.631 and weighted average of 4.7%. Similarly, the statistical analysis conducted on geographies consisting of 19,884,840 people shows a weak positive correlation between the proportion of Yakama and unemploymnet rate among females in the United States with a correlation coefficient (R) of 0.263 and weighted average of 6.7%, a difference of 41.9%.
Female Unemployment Correlation Summary
| Measurement | British | Yakama |
| Minimum | 3.1% | 2.9% |
| Maximum | 36.8% | 12.8% |
| Range | 33.7% | 9.9% |
| Mean | 11.7% | 7.6% |
| Median | 6.5% | 7.4% |
| Interquartile 25% (IQ1) | 4.3% | 5.5% |
| Interquartile 75% (IQ3) | 16.8% | 9.9% |
| Interquartile Range (IQR) | 12.5% | 4.5% |
| Standard Deviation (Sample) | 10.5% | 2.7% |
| Standard Deviation (Population) | 10.4% | 2.7% |
Similar Demographics by Female Unemployment
Demographics Similar to British by Female Unemployment
In terms of female unemployment, the demographic groups most similar to British are Irish (4.7%, a difference of 0.030%), Cypriot (4.7%, a difference of 0.040%), Lithuanian (4.7%, a difference of 0.16%), Immigrants from Bosnia and Herzegovina (4.7%, a difference of 0.17%), and Immigrants from India (4.7%, a difference of 0.20%).
| Demographics | Rating | Rank | Female Unemployment |
| Bulgarians | 99.9 /100 | #20 | Exceptional 4.7% |
| Fijians | 99.9 /100 | #21 | Exceptional 4.7% |
| Europeans | 99.9 /100 | #22 | Exceptional 4.7% |
| Scottish | 99.9 /100 | #23 | Exceptional 4.7% |
| Welsh | 99.9 /100 | #24 | Exceptional 4.7% |
| Immigrants | India | 99.9 /100 | #25 | Exceptional 4.7% |
| Immigrants | Bosnia and Herzegovina | 99.9 /100 | #26 | Exceptional 4.7% |
| British | 99.9 /100 | #27 | Exceptional 4.7% |
| Irish | 99.9 /100 | #28 | Exceptional 4.7% |
| Cypriots | 99.9 /100 | #29 | Exceptional 4.7% |
| Lithuanians | 99.8 /100 | #30 | Exceptional 4.7% |
| Sudanese | 99.8 /100 | #31 | Exceptional 4.8% |
| Slovaks | 99.8 /100 | #32 | Exceptional 4.8% |
| Czechoslovakians | 99.7 /100 | #33 | Exceptional 4.8% |
| Zimbabweans | 99.7 /100 | #34 | Exceptional 4.8% |
Demographics Similar to Yakama by Female Unemployment
In terms of female unemployment, the demographic groups most similar to Yakama are Immigrants from Guyana (6.7%, a difference of 0.57%), Guyanese (6.7%, a difference of 0.94%), Paiute (6.8%, a difference of 1.1%), Alaska Native (6.6%, a difference of 1.4%), and Native/Alaskan (6.6%, a difference of 1.5%).
| Demographics | Rating | Rank | Female Unemployment |
| Immigrants | Belize | 0.0 /100 | #323 | Tragic 6.5% |
| Cheyenne | 0.0 /100 | #324 | Tragic 6.6% |
| Apache | 0.0 /100 | #325 | Tragic 6.6% |
| Natives/Alaskans | 0.0 /100 | #326 | Tragic 6.6% |
| Alaska Natives | 0.0 /100 | #327 | Tragic 6.6% |
| Guyanese | 0.0 /100 | #328 | Tragic 6.7% |
| Immigrants | Guyana | 0.0 /100 | #329 | Tragic 6.7% |
| Yakama | 0.0 /100 | #330 | Tragic 6.7% |
| Paiute | 0.0 /100 | #331 | Tragic 6.8% |
| Sioux | 0.0 /100 | #332 | Tragic 7.0% |
| Menominee | 0.0 /100 | #333 | Tragic 7.0% |
| Immigrants | Armenia | 0.0 /100 | #334 | Tragic 7.1% |
| Dominicans | 0.0 /100 | #335 | Tragic 7.2% |
| Immigrants | Dominican Republic | 0.0 /100 | #336 | Tragic 7.2% |
| Navajo | 0.0 /100 | #337 | Tragic 7.3% |