British vs Immigrants from Mexico Doctorate Degree
COMPARE
British
Immigrants from Mexico
Doctorate Degree
Doctorate Degree Comparison
British
Immigrants from Mexico
2.2%
DOCTORATE DEGREE
99.3/ 100
METRIC RATING
89th/ 347
METRIC RANK
1.1%
DOCTORATE DEGREE
0.0/ 100
METRIC RATING
344th/ 347
METRIC RANK
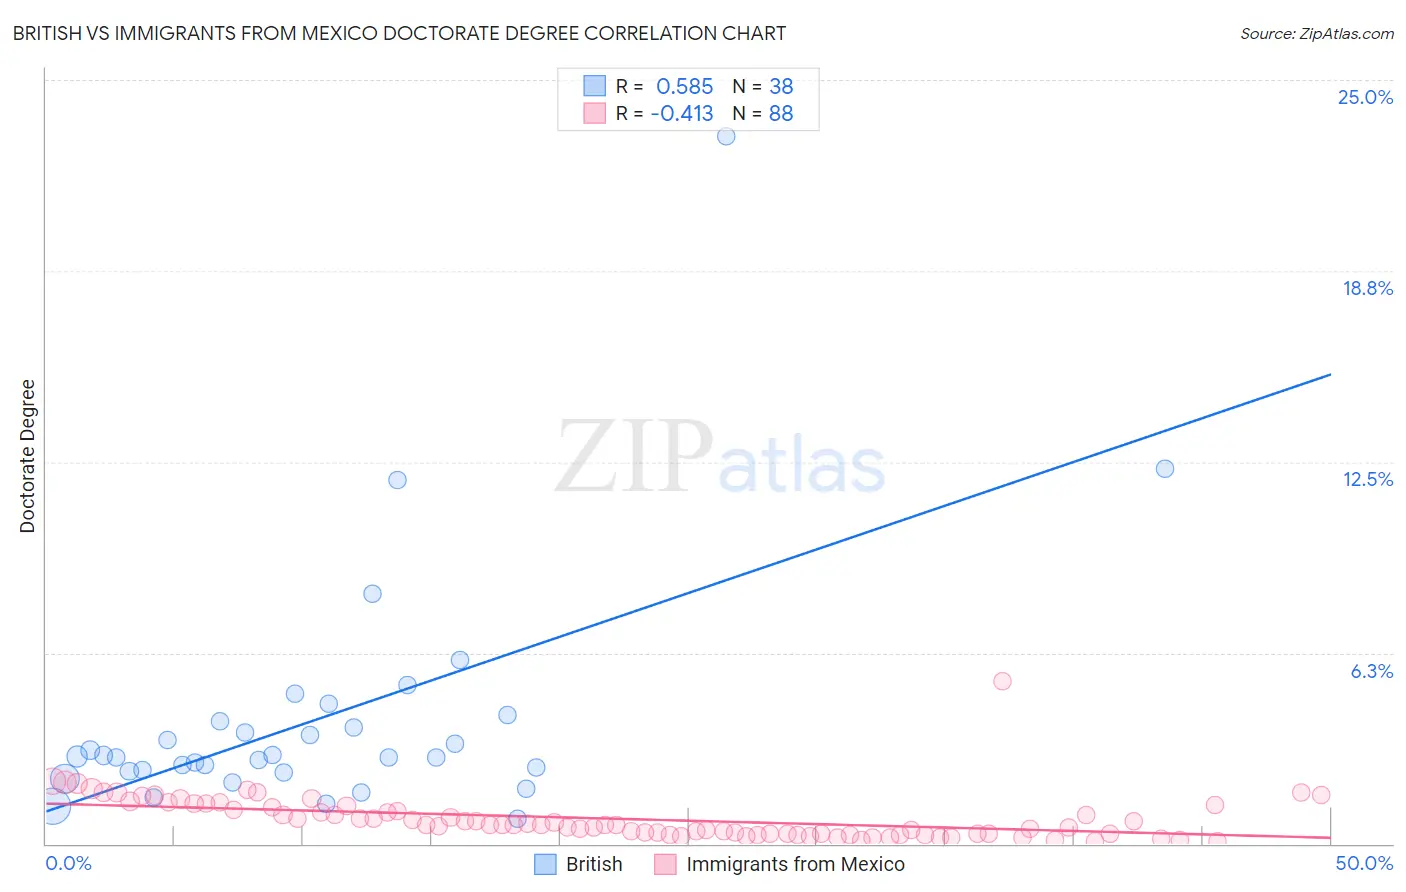
British vs Immigrants from Mexico Doctorate Degree Correlation Chart
The statistical analysis conducted on geographies consisting of 517,011,664 people shows a substantial positive correlation between the proportion of British and percentage of population with at least doctorate degree education in the United States with a correlation coefficient (R) of 0.585 and weighted average of 2.2%. Similarly, the statistical analysis conducted on geographies consisting of 497,630,711 people shows a moderate negative correlation between the proportion of Immigrants from Mexico and percentage of population with at least doctorate degree education in the United States with a correlation coefficient (R) of -0.413 and weighted average of 1.1%, a difference of 96.1%.
Doctorate Degree Correlation Summary
| Measurement | British | Immigrants from Mexico |
| Minimum | 0.83% | 0.070% |
| Maximum | 23.1% | 5.3% |
| Range | 22.3% | 5.2% |
| Mean | 4.1% | 0.81% |
| Median | 2.8% | 0.61% |
| Interquartile 25% (IQ1) | 2.4% | 0.32% |
| Interquartile 75% (IQ3) | 4.0% | 1.2% |
| Interquartile Range (IQR) | 1.6% | 0.90% |
| Standard Deviation (Sample) | 4.0% | 0.72% |
| Standard Deviation (Population) | 4.0% | 0.72% |
Similar Demographics by Doctorate Degree
Demographics Similar to British by Doctorate Degree
In terms of doctorate degree, the demographic groups most similar to British are Immigrants from Scotland (2.2%, a difference of 0.020%), Immigrants from Nepal (2.2%, a difference of 0.44%), Immigrants from Sudan (2.2%, a difference of 0.49%), Chilean (2.2%, a difference of 0.75%), and Immigrants from Zimbabwe (2.2%, a difference of 0.80%).
| Demographics | Rating | Rank | Doctorate Degree |
| Immigrants | Uganda | 99.6 /100 | #82 | Exceptional 2.2% |
| Immigrants | Lithuania | 99.6 /100 | #83 | Exceptional 2.2% |
| Immigrants | England | 99.6 /100 | #84 | Exceptional 2.2% |
| Immigrants | Brazil | 99.6 /100 | #85 | Exceptional 2.2% |
| Egyptians | 99.4 /100 | #86 | Exceptional 2.2% |
| Immigrants | Zimbabwe | 99.4 /100 | #87 | Exceptional 2.2% |
| Immigrants | Nepal | 99.3 /100 | #88 | Exceptional 2.2% |
| British | 99.3 /100 | #89 | Exceptional 2.2% |
| Immigrants | Scotland | 99.2 /100 | #90 | Exceptional 2.2% |
| Immigrants | Sudan | 99.1 /100 | #91 | Exceptional 2.2% |
| Chileans | 99.1 /100 | #92 | Exceptional 2.2% |
| Alsatians | 99.0 /100 | #93 | Exceptional 2.1% |
| Greeks | 98.8 /100 | #94 | Exceptional 2.1% |
| Immigrants | Romania | 98.7 /100 | #95 | Exceptional 2.1% |
| Immigrants | Northern Africa | 98.4 /100 | #96 | Exceptional 2.1% |
Demographics Similar to Immigrants from Mexico by Doctorate Degree
In terms of doctorate degree, the demographic groups most similar to Immigrants from Mexico are Lumbee (1.1%, a difference of 1.5%), Fijian (1.1%, a difference of 2.1%), Spanish American Indian (1.1%, a difference of 4.4%), Arapaho (1.2%, a difference of 5.6%), and Mexican (1.2%, a difference of 5.9%).
| Demographics | Rating | Rank | Doctorate Degree |
| Immigrants | Caribbean | 0.0 /100 | #333 | Tragic 1.3% |
| Immigrants | Dominican Republic | 0.0 /100 | #334 | Tragic 1.3% |
| Immigrants | Haiti | 0.0 /100 | #335 | Tragic 1.3% |
| Nepalese | 0.0 /100 | #336 | Tragic 1.3% |
| Bangladeshis | 0.0 /100 | #337 | Tragic 1.2% |
| Puget Sound Salish | 0.0 /100 | #338 | Tragic 1.2% |
| Immigrants | Central America | 0.0 /100 | #339 | Tragic 1.2% |
| Immigrants | Cuba | 0.0 /100 | #340 | Tragic 1.2% |
| Mexicans | 0.0 /100 | #341 | Tragic 1.2% |
| Arapaho | 0.0 /100 | #342 | Tragic 1.2% |
| Fijians | 0.0 /100 | #343 | Tragic 1.1% |
| Immigrants | Mexico | 0.0 /100 | #344 | Tragic 1.1% |
| Lumbee | 0.0 /100 | #345 | Tragic 1.1% |
| Spanish American Indians | 0.0 /100 | #346 | Tragic 1.1% |
| Houma | 0.0 /100 | #347 | Tragic 0.96% |