British vs Bahamian Female Unemployment
COMPARE
British
Bahamian
Female Unemployment
Female Unemployment Comparison
British
Bahamians
4.7%
FEMALE UNEMPLOYMENT
99.9/ 100
METRIC RATING
27th/ 347
METRIC RANK
6.0%
FEMALE UNEMPLOYMENT
0.0/ 100
METRIC RATING
276th/ 347
METRIC RANK
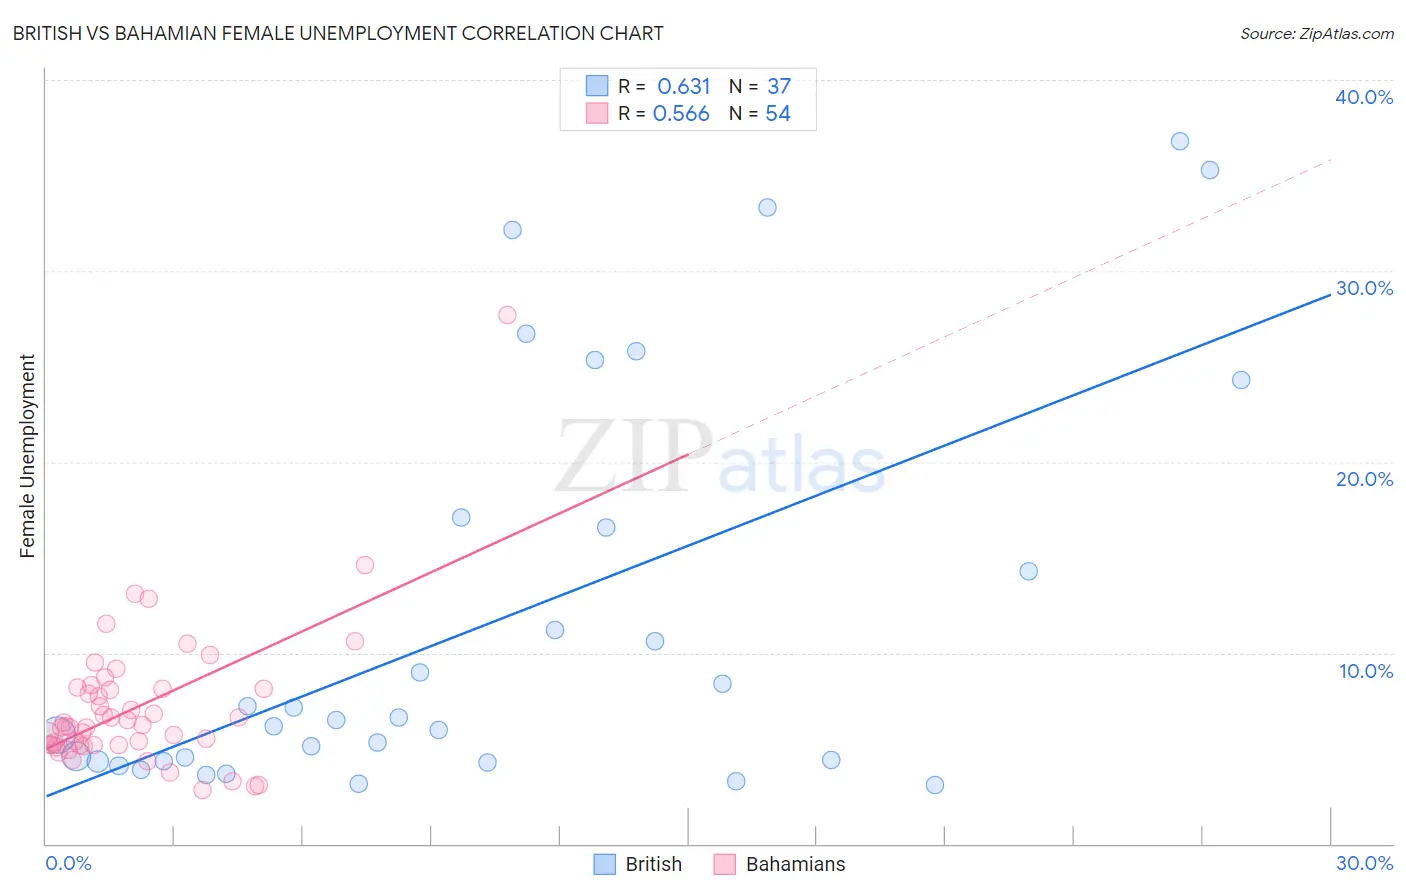
British vs Bahamian Female Unemployment Correlation Chart
The statistical analysis conducted on geographies consisting of 523,107,564 people shows a significant positive correlation between the proportion of British and unemploymnet rate among females in the United States with a correlation coefficient (R) of 0.631 and weighted average of 4.7%. Similarly, the statistical analysis conducted on geographies consisting of 112,545,227 people shows a substantial positive correlation between the proportion of Bahamians and unemploymnet rate among females in the United States with a correlation coefficient (R) of 0.566 and weighted average of 6.0%, a difference of 26.3%.
Female Unemployment Correlation Summary
| Measurement | British | Bahamian |
| Minimum | 3.1% | 2.8% |
| Maximum | 36.8% | 27.7% |
| Range | 33.7% | 24.9% |
| Mean | 11.7% | 7.2% |
| Median | 6.5% | 6.2% |
| Interquartile 25% (IQ1) | 4.3% | 5.2% |
| Interquartile 75% (IQ3) | 16.8% | 8.1% |
| Interquartile Range (IQR) | 12.5% | 2.9% |
| Standard Deviation (Sample) | 10.5% | 3.8% |
| Standard Deviation (Population) | 10.4% | 3.8% |
Similar Demographics by Female Unemployment
Demographics Similar to British by Female Unemployment
In terms of female unemployment, the demographic groups most similar to British are Irish (4.7%, a difference of 0.030%), Cypriot (4.7%, a difference of 0.040%), Lithuanian (4.7%, a difference of 0.16%), Immigrants from Bosnia and Herzegovina (4.7%, a difference of 0.17%), and Immigrants from India (4.7%, a difference of 0.20%).
| Demographics | Rating | Rank | Female Unemployment |
| Bulgarians | 99.9 /100 | #20 | Exceptional 4.7% |
| Fijians | 99.9 /100 | #21 | Exceptional 4.7% |
| Europeans | 99.9 /100 | #22 | Exceptional 4.7% |
| Scottish | 99.9 /100 | #23 | Exceptional 4.7% |
| Welsh | 99.9 /100 | #24 | Exceptional 4.7% |
| Immigrants | India | 99.9 /100 | #25 | Exceptional 4.7% |
| Immigrants | Bosnia and Herzegovina | 99.9 /100 | #26 | Exceptional 4.7% |
| British | 99.9 /100 | #27 | Exceptional 4.7% |
| Irish | 99.9 /100 | #28 | Exceptional 4.7% |
| Cypriots | 99.9 /100 | #29 | Exceptional 4.7% |
| Lithuanians | 99.8 /100 | #30 | Exceptional 4.7% |
| Sudanese | 99.8 /100 | #31 | Exceptional 4.8% |
| Slovaks | 99.8 /100 | #32 | Exceptional 4.8% |
| Czechoslovakians | 99.7 /100 | #33 | Exceptional 4.8% |
| Zimbabweans | 99.7 /100 | #34 | Exceptional 4.8% |
Demographics Similar to Bahamians by Female Unemployment
In terms of female unemployment, the demographic groups most similar to Bahamians are Senegalese (6.0%, a difference of 0.040%), Immigrants from Ghana (6.0%, a difference of 0.40%), Yaqui (6.0%, a difference of 0.40%), Armenian (6.0%, a difference of 0.51%), and African (5.9%, a difference of 0.53%).
| Demographics | Rating | Rank | Female Unemployment |
| Immigrants | Western Africa | 0.0 /100 | #269 | Tragic 5.9% |
| Immigrants | Honduras | 0.0 /100 | #270 | Tragic 5.9% |
| Central Americans | 0.0 /100 | #271 | Tragic 5.9% |
| Lumbee | 0.0 /100 | #272 | Tragic 5.9% |
| Ghanaians | 0.0 /100 | #273 | Tragic 5.9% |
| Africans | 0.0 /100 | #274 | Tragic 5.9% |
| Senegalese | 0.0 /100 | #275 | Tragic 6.0% |
| Bahamians | 0.0 /100 | #276 | Tragic 6.0% |
| Immigrants | Ghana | 0.0 /100 | #277 | Tragic 6.0% |
| Yaqui | 0.0 /100 | #278 | Tragic 6.0% |
| Armenians | 0.0 /100 | #279 | Tragic 6.0% |
| Mexican American Indians | 0.0 /100 | #280 | Tragic 6.0% |
| Guatemalans | 0.0 /100 | #281 | Tragic 6.0% |
| Colville | 0.0 /100 | #282 | Tragic 6.0% |
| Salvadorans | 0.0 /100 | #283 | Tragic 6.0% |