Senegalese vs Immigrants from Mexico Female Unemployment
COMPARE
Senegalese
Immigrants from Mexico
Female Unemployment
Female Unemployment Comparison
Senegalese
Immigrants from Mexico
6.0%
FEMALE UNEMPLOYMENT
0.0/ 100
METRIC RATING
275th/ 347
METRIC RANK
6.3%
FEMALE UNEMPLOYMENT
0.0/ 100
METRIC RATING
311th/ 347
METRIC RANK
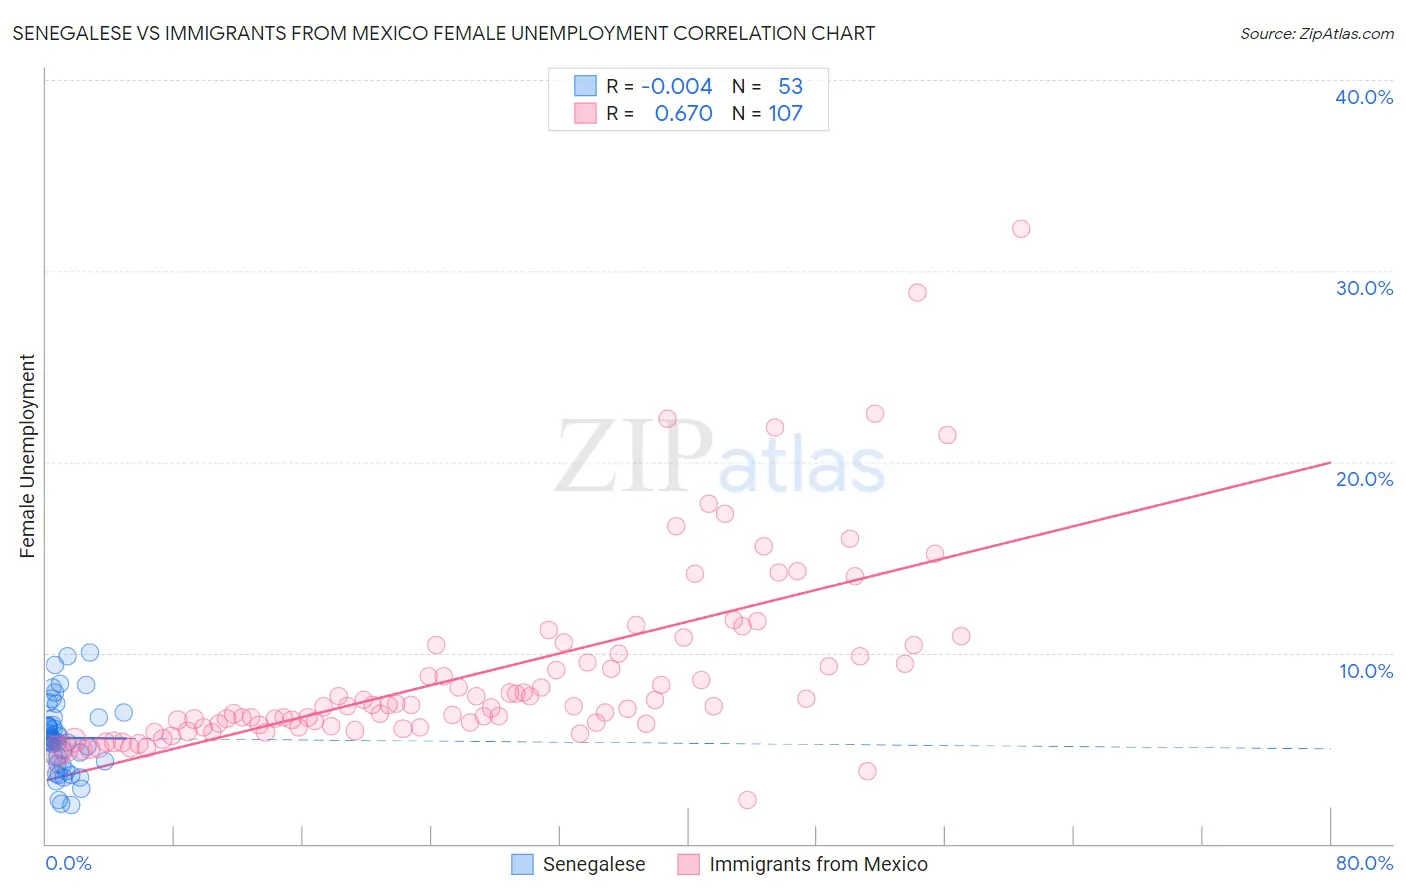
Senegalese vs Immigrants from Mexico Female Unemployment Correlation Chart
The statistical analysis conducted on geographies consisting of 78,123,834 people shows no correlation between the proportion of Senegalese and unemploymnet rate among females in the United States with a correlation coefficient (R) of -0.004 and weighted average of 6.0%. Similarly, the statistical analysis conducted on geographies consisting of 506,833,081 people shows a significant positive correlation between the proportion of Immigrants from Mexico and unemploymnet rate among females in the United States with a correlation coefficient (R) of 0.670 and weighted average of 6.3%, a difference of 5.4%.
Female Unemployment Correlation Summary
| Measurement | Senegalese | Immigrants from Mexico |
| Minimum | 2.0% | 2.3% |
| Maximum | 10.0% | 32.2% |
| Range | 8.0% | 29.9% |
| Mean | 5.5% | 9.0% |
| Median | 5.4% | 7.2% |
| Interquartile 25% (IQ1) | 4.3% | 6.1% |
| Interquartile 75% (IQ3) | 6.4% | 9.9% |
| Interquartile Range (IQR) | 2.2% | 3.8% |
| Standard Deviation (Sample) | 1.8% | 5.0% |
| Standard Deviation (Population) | 1.8% | 5.0% |
Similar Demographics by Female Unemployment
Demographics Similar to Senegalese by Female Unemployment
In terms of female unemployment, the demographic groups most similar to Senegalese are Bahamian (6.0%, a difference of 0.040%), Immigrants from Ghana (6.0%, a difference of 0.43%), Yaqui (6.0%, a difference of 0.43%), African (5.9%, a difference of 0.49%), and Armenian (6.0%, a difference of 0.55%).
| Demographics | Rating | Rank | Female Unemployment |
| Hondurans | 0.0 /100 | #268 | Tragic 5.9% |
| Immigrants | Western Africa | 0.0 /100 | #269 | Tragic 5.9% |
| Immigrants | Honduras | 0.0 /100 | #270 | Tragic 5.9% |
| Central Americans | 0.0 /100 | #271 | Tragic 5.9% |
| Lumbee | 0.0 /100 | #272 | Tragic 5.9% |
| Ghanaians | 0.0 /100 | #273 | Tragic 5.9% |
| Africans | 0.0 /100 | #274 | Tragic 5.9% |
| Senegalese | 0.0 /100 | #275 | Tragic 6.0% |
| Bahamians | 0.0 /100 | #276 | Tragic 6.0% |
| Immigrants | Ghana | 0.0 /100 | #277 | Tragic 6.0% |
| Yaqui | 0.0 /100 | #278 | Tragic 6.0% |
| Armenians | 0.0 /100 | #279 | Tragic 6.0% |
| Mexican American Indians | 0.0 /100 | #280 | Tragic 6.0% |
| Guatemalans | 0.0 /100 | #281 | Tragic 6.0% |
| Colville | 0.0 /100 | #282 | Tragic 6.0% |
Demographics Similar to Immigrants from Mexico by Female Unemployment
In terms of female unemployment, the demographic groups most similar to Immigrants from Mexico are Central American Indian (6.3%, a difference of 0.13%), Ecuadorian (6.3%, a difference of 0.54%), Immigrants from Grenada (6.3%, a difference of 0.66%), Belizean (6.3%, a difference of 0.67%), and Immigrants from Ecuador (6.4%, a difference of 0.90%).
| Demographics | Rating | Rank | Female Unemployment |
| Immigrants | Jamaica | 0.0 /100 | #304 | Tragic 6.2% |
| Spanish American Indians | 0.0 /100 | #305 | Tragic 6.2% |
| Immigrants | Central America | 0.0 /100 | #306 | Tragic 6.2% |
| Shoshone | 0.0 /100 | #307 | Tragic 6.2% |
| Hispanics or Latinos | 0.0 /100 | #308 | Tragic 6.2% |
| Ecuadorians | 0.0 /100 | #309 | Tragic 6.3% |
| Central American Indians | 0.0 /100 | #310 | Tragic 6.3% |
| Immigrants | Mexico | 0.0 /100 | #311 | Tragic 6.3% |
| Immigrants | Grenada | 0.0 /100 | #312 | Tragic 6.3% |
| Belizeans | 0.0 /100 | #313 | Tragic 6.3% |
| Immigrants | Ecuador | 0.0 /100 | #314 | Tragic 6.4% |
| Pueblo | 0.0 /100 | #315 | Tragic 6.4% |
| Houma | 0.0 /100 | #316 | Tragic 6.4% |
| Immigrants | St. Vincent and the Grenadines | 0.0 /100 | #317 | Tragic 6.4% |
| British West Indians | 0.0 /100 | #318 | Tragic 6.4% |