British vs South American Indian Female Unemployment
COMPARE
British
South American Indian
Female Unemployment
Female Unemployment Comparison
British
South American Indians
4.7%
FEMALE UNEMPLOYMENT
99.9/ 100
METRIC RATING
27th/ 347
METRIC RANK
5.5%
FEMALE UNEMPLOYMENT
2.8/ 100
METRIC RATING
241st/ 347
METRIC RANK
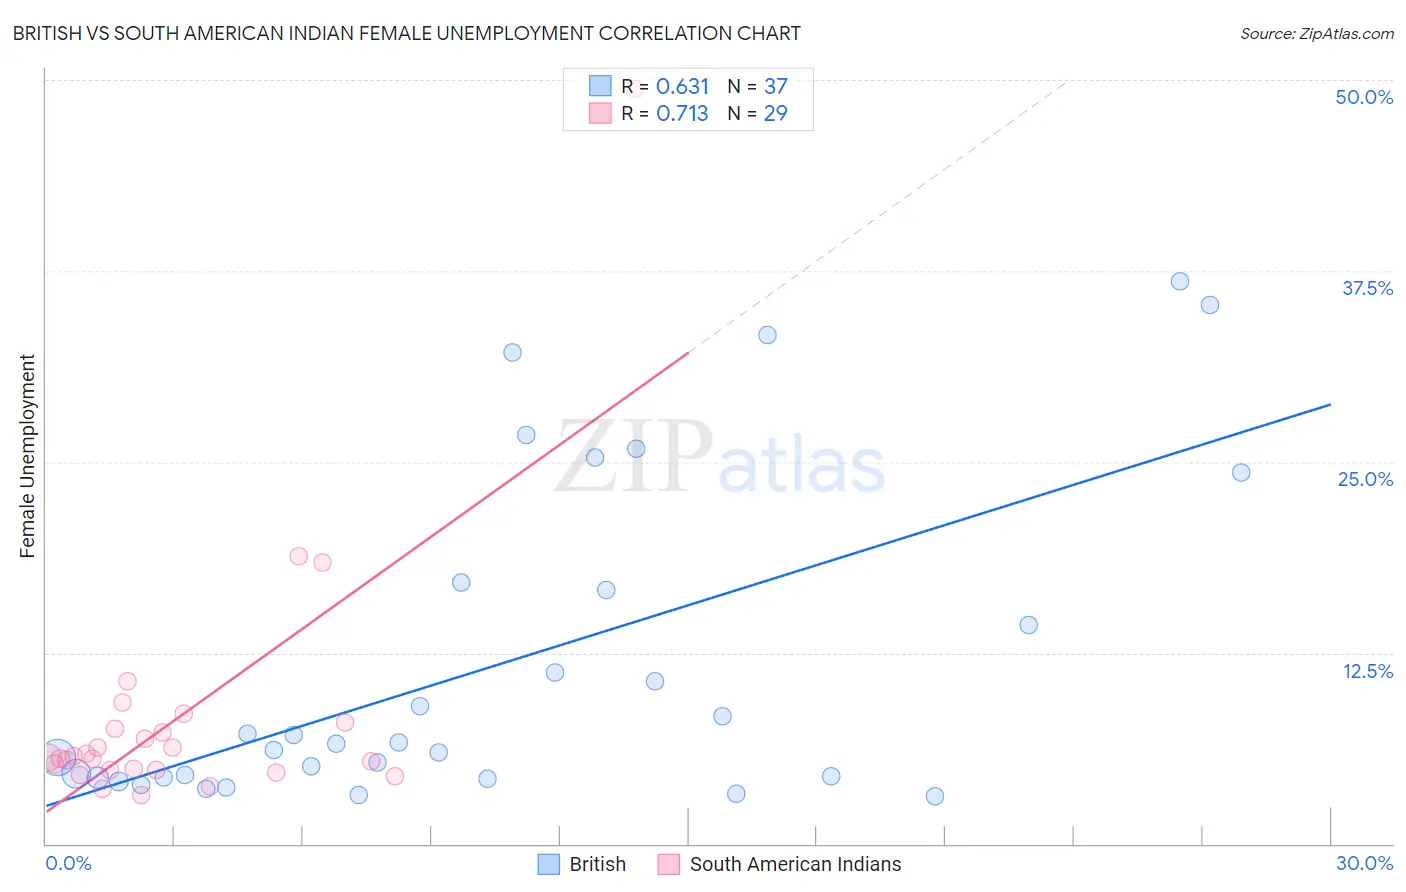
British vs South American Indian Female Unemployment Correlation Chart
The statistical analysis conducted on geographies consisting of 523,107,564 people shows a significant positive correlation between the proportion of British and unemploymnet rate among females in the United States with a correlation coefficient (R) of 0.631 and weighted average of 4.7%. Similarly, the statistical analysis conducted on geographies consisting of 164,368,347 people shows a strong positive correlation between the proportion of South American Indians and unemploymnet rate among females in the United States with a correlation coefficient (R) of 0.713 and weighted average of 5.5%, a difference of 16.9%.
Female Unemployment Correlation Summary
| Measurement | British | South American Indian |
| Minimum | 3.1% | 3.2% |
| Maximum | 36.8% | 49.4% |
| Range | 33.7% | 46.2% |
| Mean | 11.7% | 8.3% |
| Median | 6.5% | 5.6% |
| Interquartile 25% (IQ1) | 4.3% | 4.8% |
| Interquartile 75% (IQ3) | 16.8% | 7.7% |
| Interquartile Range (IQR) | 12.5% | 2.9% |
| Standard Deviation (Sample) | 10.5% | 8.7% |
| Standard Deviation (Population) | 10.4% | 8.6% |
Similar Demographics by Female Unemployment
Demographics Similar to British by Female Unemployment
In terms of female unemployment, the demographic groups most similar to British are Irish (4.7%, a difference of 0.030%), Cypriot (4.7%, a difference of 0.040%), Lithuanian (4.7%, a difference of 0.16%), Immigrants from Bosnia and Herzegovina (4.7%, a difference of 0.17%), and Immigrants from India (4.7%, a difference of 0.20%).
| Demographics | Rating | Rank | Female Unemployment |
| Bulgarians | 99.9 /100 | #20 | Exceptional 4.7% |
| Fijians | 99.9 /100 | #21 | Exceptional 4.7% |
| Europeans | 99.9 /100 | #22 | Exceptional 4.7% |
| Scottish | 99.9 /100 | #23 | Exceptional 4.7% |
| Welsh | 99.9 /100 | #24 | Exceptional 4.7% |
| Immigrants | India | 99.9 /100 | #25 | Exceptional 4.7% |
| Immigrants | Bosnia and Herzegovina | 99.9 /100 | #26 | Exceptional 4.7% |
| British | 99.9 /100 | #27 | Exceptional 4.7% |
| Irish | 99.9 /100 | #28 | Exceptional 4.7% |
| Cypriots | 99.9 /100 | #29 | Exceptional 4.7% |
| Lithuanians | 99.8 /100 | #30 | Exceptional 4.7% |
| Sudanese | 99.8 /100 | #31 | Exceptional 4.8% |
| Slovaks | 99.8 /100 | #32 | Exceptional 4.8% |
| Czechoslovakians | 99.7 /100 | #33 | Exceptional 4.8% |
| Zimbabweans | 99.7 /100 | #34 | Exceptional 4.8% |
Demographics Similar to South American Indians by Female Unemployment
In terms of female unemployment, the demographic groups most similar to South American Indians are Immigrants from South America (5.5%, a difference of 0.050%), Aleut (5.5%, a difference of 0.080%), Sierra Leonean (5.5%, a difference of 0.18%), Immigrants from Panama (5.5%, a difference of 0.20%), and Immigrants from Cambodia (5.5%, a difference of 0.23%).
| Demographics | Rating | Rank | Female Unemployment |
| Immigrants | Lebanon | 3.3 /100 | #234 | Tragic 5.5% |
| Immigrants | Iran | 3.3 /100 | #235 | Tragic 5.5% |
| Immigrants | Cambodia | 3.3 /100 | #236 | Tragic 5.5% |
| Immigrants | Panama | 3.2 /100 | #237 | Tragic 5.5% |
| Sierra Leoneans | 3.2 /100 | #238 | Tragic 5.5% |
| Aleuts | 3.0 /100 | #239 | Tragic 5.5% |
| Immigrants | South America | 2.9 /100 | #240 | Tragic 5.5% |
| South American Indians | 2.8 /100 | #241 | Tragic 5.5% |
| Marshallese | 2.3 /100 | #242 | Tragic 5.6% |
| Spanish Americans | 2.2 /100 | #243 | Tragic 5.6% |
| Immigrants | Liberia | 1.5 /100 | #244 | Tragic 5.6% |
| Guamanians/Chamorros | 1.4 /100 | #245 | Tragic 5.6% |
| Japanese | 1.2 /100 | #246 | Tragic 5.6% |
| Immigrants | Western Asia | 1.1 /100 | #247 | Tragic 5.6% |
| Cree | 1.0 /100 | #248 | Tragic 5.6% |