Iranian vs Immigrants from Mexico Female Unemployment
COMPARE
Iranian
Immigrants from Mexico
Female Unemployment
Female Unemployment Comparison
Iranians
Immigrants from Mexico
5.3%
FEMALE UNEMPLOYMENT
50.4/ 100
METRIC RATING
173rd/ 347
METRIC RANK
6.3%
FEMALE UNEMPLOYMENT
0.0/ 100
METRIC RATING
311th/ 347
METRIC RANK
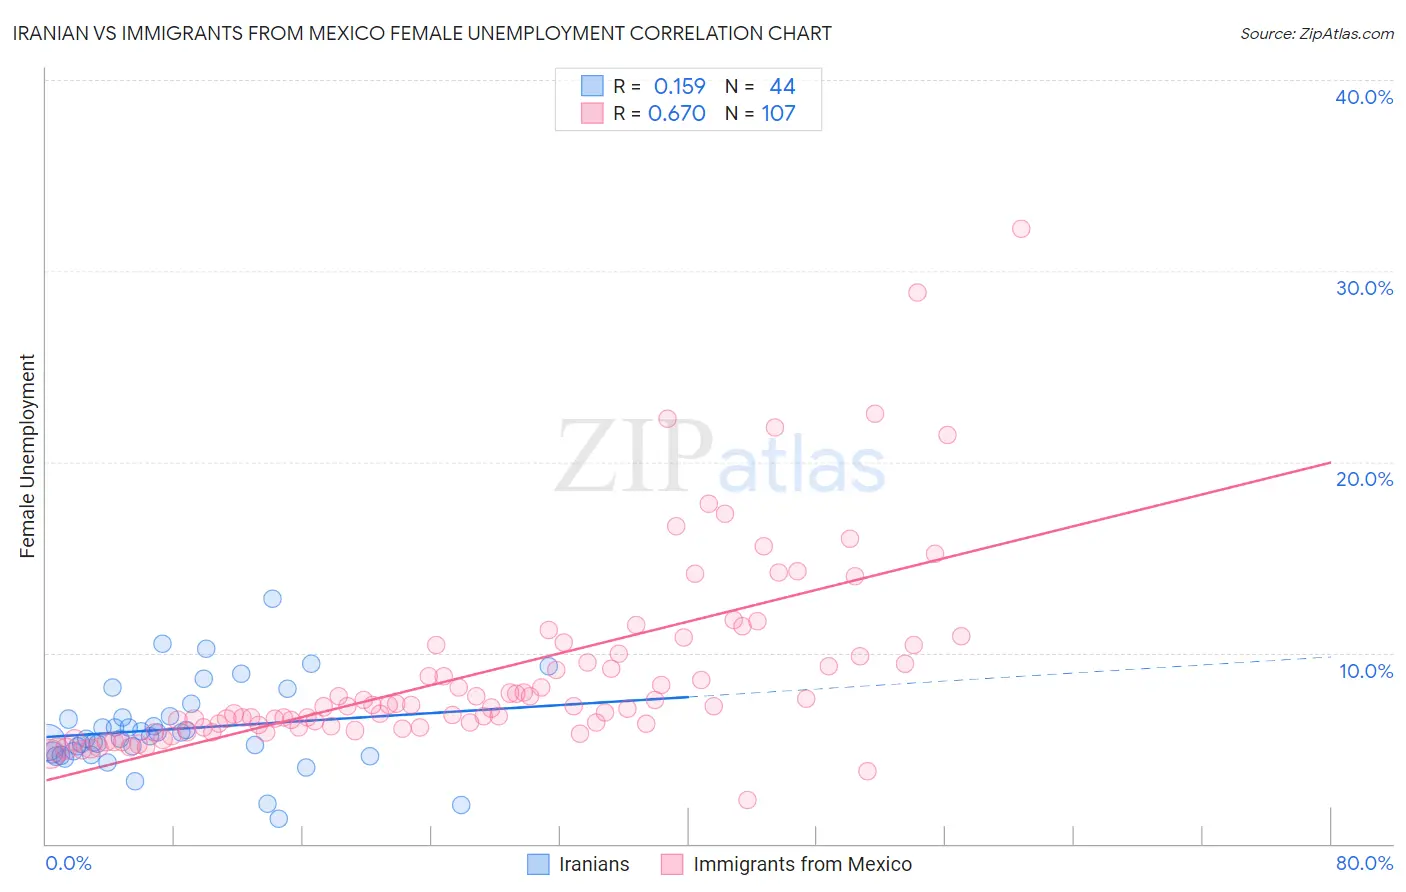
Iranian vs Immigrants from Mexico Female Unemployment Correlation Chart
The statistical analysis conducted on geographies consisting of 316,106,096 people shows a poor positive correlation between the proportion of Iranians and unemploymnet rate among females in the United States with a correlation coefficient (R) of 0.159 and weighted average of 5.3%. Similarly, the statistical analysis conducted on geographies consisting of 506,833,081 people shows a significant positive correlation between the proportion of Immigrants from Mexico and unemploymnet rate among females in the United States with a correlation coefficient (R) of 0.670 and weighted average of 6.3%, a difference of 19.9%.
Female Unemployment Correlation Summary
| Measurement | Iranian | Immigrants from Mexico |
| Minimum | 1.3% | 2.3% |
| Maximum | 12.8% | 32.2% |
| Range | 11.5% | 29.9% |
| Mean | 6.0% | 9.0% |
| Median | 5.6% | 7.2% |
| Interquartile 25% (IQ1) | 4.7% | 6.1% |
| Interquartile 75% (IQ3) | 6.6% | 9.9% |
| Interquartile Range (IQR) | 1.9% | 3.8% |
| Standard Deviation (Sample) | 2.3% | 5.0% |
| Standard Deviation (Population) | 2.2% | 5.0% |
Similar Demographics by Female Unemployment
Demographics Similar to Iranians by Female Unemployment
In terms of female unemployment, the demographic groups most similar to Iranians are Immigrants from Uganda (5.3%, a difference of 0.020%), Immigrants from Poland (5.3%, a difference of 0.020%), Immigrants from Laos (5.3%, a difference of 0.17%), Immigrants from Vietnam (5.3%, a difference of 0.18%), and Immigrants from Morocco (5.3%, a difference of 0.18%).
| Demographics | Rating | Rank | Female Unemployment |
| Native Hawaiians | 62.7 /100 | #166 | Good 5.2% |
| Immigrants | Thailand | 62.1 /100 | #167 | Good 5.2% |
| Sri Lankans | 59.4 /100 | #168 | Average 5.2% |
| Immigrants | Chile | 59.0 /100 | #169 | Average 5.2% |
| Spanish | 55.9 /100 | #170 | Average 5.2% |
| Immigrants | Denmark | 55.0 /100 | #171 | Average 5.2% |
| Immigrants | Uganda | 50.7 /100 | #172 | Average 5.3% |
| Iranians | 50.4 /100 | #173 | Average 5.3% |
| Immigrants | Poland | 50.0 /100 | #174 | Average 5.3% |
| Immigrants | Laos | 47.5 /100 | #175 | Average 5.3% |
| Immigrants | Vietnam | 47.5 /100 | #176 | Average 5.3% |
| Immigrants | Morocco | 47.4 /100 | #177 | Average 5.3% |
| Immigrants | Southern Europe | 46.2 /100 | #178 | Average 5.3% |
| Laotians | 45.1 /100 | #179 | Average 5.3% |
| Immigrants | Congo | 43.1 /100 | #180 | Average 5.3% |
Demographics Similar to Immigrants from Mexico by Female Unemployment
In terms of female unemployment, the demographic groups most similar to Immigrants from Mexico are Central American Indian (6.3%, a difference of 0.13%), Ecuadorian (6.3%, a difference of 0.54%), Immigrants from Grenada (6.3%, a difference of 0.66%), Belizean (6.3%, a difference of 0.67%), and Immigrants from Ecuador (6.4%, a difference of 0.90%).
| Demographics | Rating | Rank | Female Unemployment |
| Immigrants | Jamaica | 0.0 /100 | #304 | Tragic 6.2% |
| Spanish American Indians | 0.0 /100 | #305 | Tragic 6.2% |
| Immigrants | Central America | 0.0 /100 | #306 | Tragic 6.2% |
| Shoshone | 0.0 /100 | #307 | Tragic 6.2% |
| Hispanics or Latinos | 0.0 /100 | #308 | Tragic 6.2% |
| Ecuadorians | 0.0 /100 | #309 | Tragic 6.3% |
| Central American Indians | 0.0 /100 | #310 | Tragic 6.3% |
| Immigrants | Mexico | 0.0 /100 | #311 | Tragic 6.3% |
| Immigrants | Grenada | 0.0 /100 | #312 | Tragic 6.3% |
| Belizeans | 0.0 /100 | #313 | Tragic 6.3% |
| Immigrants | Ecuador | 0.0 /100 | #314 | Tragic 6.4% |
| Pueblo | 0.0 /100 | #315 | Tragic 6.4% |
| Houma | 0.0 /100 | #316 | Tragic 6.4% |
| Immigrants | St. Vincent and the Grenadines | 0.0 /100 | #317 | Tragic 6.4% |
| British West Indians | 0.0 /100 | #318 | Tragic 6.4% |