Kiowa vs Immigrants from Mexico Female Unemployment
COMPARE
Kiowa
Immigrants from Mexico
Female Unemployment
Female Unemployment Comparison
Kiowa
Immigrants from Mexico
5.8%
FEMALE UNEMPLOYMENT
0.1/ 100
METRIC RATING
261st/ 347
METRIC RANK
6.3%
FEMALE UNEMPLOYMENT
0.0/ 100
METRIC RATING
311th/ 347
METRIC RANK
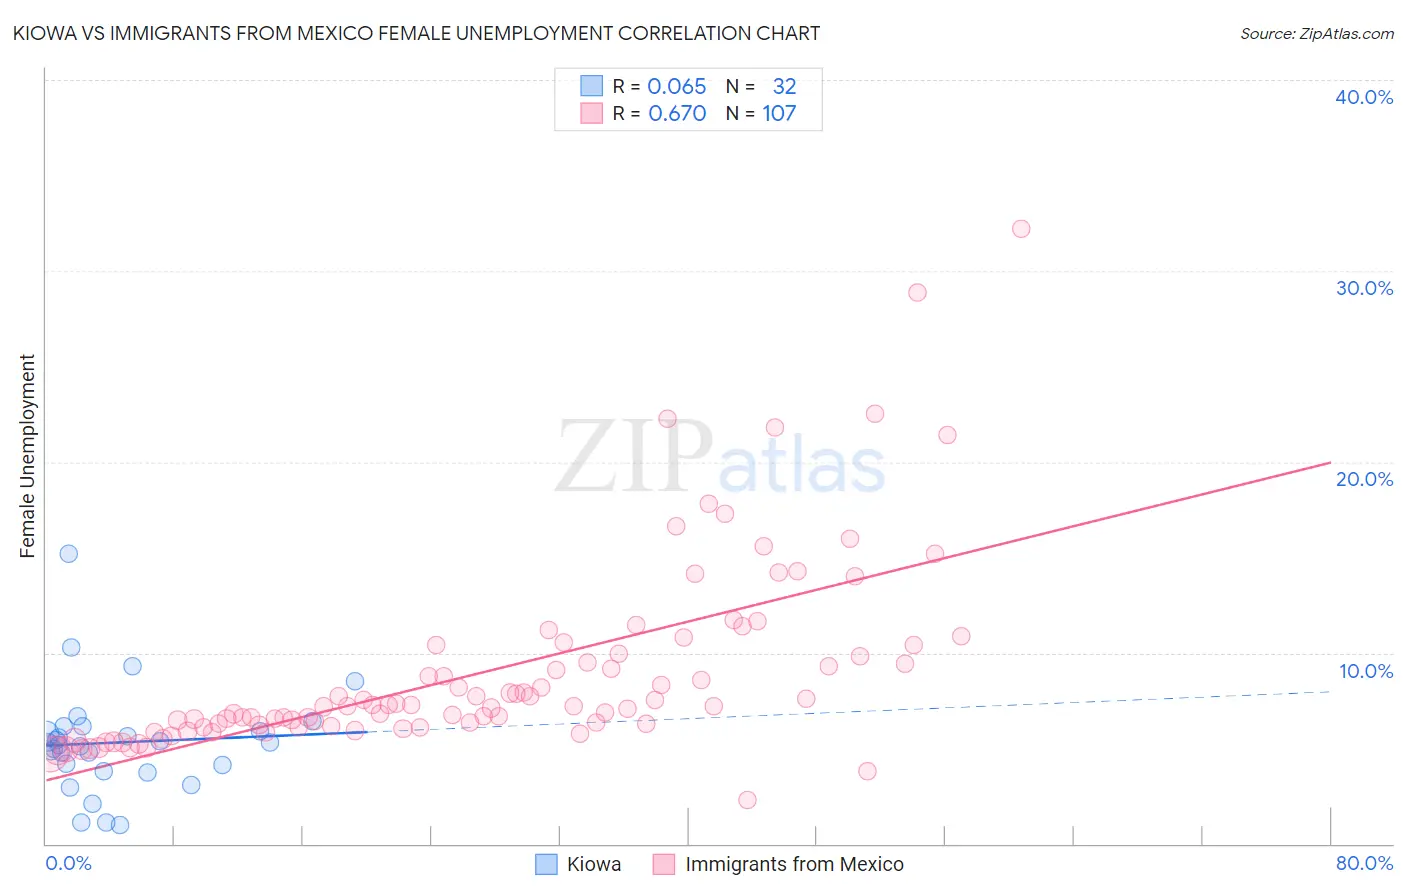
Kiowa vs Immigrants from Mexico Female Unemployment Correlation Chart
The statistical analysis conducted on geographies consisting of 55,997,054 people shows a slight positive correlation between the proportion of Kiowa and unemploymnet rate among females in the United States with a correlation coefficient (R) of 0.065 and weighted average of 5.8%. Similarly, the statistical analysis conducted on geographies consisting of 506,833,081 people shows a significant positive correlation between the proportion of Immigrants from Mexico and unemploymnet rate among females in the United States with a correlation coefficient (R) of 0.670 and weighted average of 6.3%, a difference of 9.1%.
Female Unemployment Correlation Summary
| Measurement | Kiowa | Immigrants from Mexico |
| Minimum | 1.0% | 2.3% |
| Maximum | 15.2% | 32.2% |
| Range | 14.2% | 29.9% |
| Mean | 5.3% | 9.0% |
| Median | 5.2% | 7.2% |
| Interquartile 25% (IQ1) | 4.0% | 6.1% |
| Interquartile 75% (IQ3) | 6.0% | 9.9% |
| Interquartile Range (IQR) | 2.1% | 3.8% |
| Standard Deviation (Sample) | 2.8% | 5.0% |
| Standard Deviation (Population) | 2.7% | 5.0% |
Similar Demographics by Female Unemployment
Demographics Similar to Kiowa by Female Unemployment
In terms of female unemployment, the demographic groups most similar to Kiowa are Immigrants from Nigeria (5.8%, a difference of 0.030%), Nigerian (5.8%, a difference of 0.26%), Immigrants from Fiji (5.8%, a difference of 0.30%), Immigrants from Portugal (5.8%, a difference of 0.41%), and Immigrants from the Azores (5.8%, a difference of 0.71%).
| Demographics | Rating | Rank | Female Unemployment |
| Immigrants | Immigrants | 0.6 /100 | #254 | Tragic 5.7% |
| Immigrants | Cameroon | 0.6 /100 | #255 | Tragic 5.7% |
| Sub-Saharan Africans | 0.4 /100 | #256 | Tragic 5.7% |
| Dutch West Indians | 0.3 /100 | #257 | Tragic 5.7% |
| Immigrants | Portugal | 0.2 /100 | #258 | Tragic 5.8% |
| Immigrants | Fiji | 0.2 /100 | #259 | Tragic 5.8% |
| Nigerians | 0.2 /100 | #260 | Tragic 5.8% |
| Kiowa | 0.1 /100 | #261 | Tragic 5.8% |
| Immigrants | Nigeria | 0.1 /100 | #262 | Tragic 5.8% |
| Immigrants | Azores | 0.1 /100 | #263 | Tragic 5.8% |
| Immigrants | Bahamas | 0.1 /100 | #264 | Tragic 5.8% |
| Blackfeet | 0.0 /100 | #265 | Tragic 5.9% |
| Cape Verdeans | 0.0 /100 | #266 | Tragic 5.9% |
| Nepalese | 0.0 /100 | #267 | Tragic 5.9% |
| Hondurans | 0.0 /100 | #268 | Tragic 5.9% |
Demographics Similar to Immigrants from Mexico by Female Unemployment
In terms of female unemployment, the demographic groups most similar to Immigrants from Mexico are Central American Indian (6.3%, a difference of 0.13%), Ecuadorian (6.3%, a difference of 0.54%), Immigrants from Grenada (6.3%, a difference of 0.66%), Belizean (6.3%, a difference of 0.67%), and Immigrants from Ecuador (6.4%, a difference of 0.90%).
| Demographics | Rating | Rank | Female Unemployment |
| Immigrants | Jamaica | 0.0 /100 | #304 | Tragic 6.2% |
| Spanish American Indians | 0.0 /100 | #305 | Tragic 6.2% |
| Immigrants | Central America | 0.0 /100 | #306 | Tragic 6.2% |
| Shoshone | 0.0 /100 | #307 | Tragic 6.2% |
| Hispanics or Latinos | 0.0 /100 | #308 | Tragic 6.2% |
| Ecuadorians | 0.0 /100 | #309 | Tragic 6.3% |
| Central American Indians | 0.0 /100 | #310 | Tragic 6.3% |
| Immigrants | Mexico | 0.0 /100 | #311 | Tragic 6.3% |
| Immigrants | Grenada | 0.0 /100 | #312 | Tragic 6.3% |
| Belizeans | 0.0 /100 | #313 | Tragic 6.3% |
| Immigrants | Ecuador | 0.0 /100 | #314 | Tragic 6.4% |
| Pueblo | 0.0 /100 | #315 | Tragic 6.4% |
| Houma | 0.0 /100 | #316 | Tragic 6.4% |
| Immigrants | St. Vincent and the Grenadines | 0.0 /100 | #317 | Tragic 6.4% |
| British West Indians | 0.0 /100 | #318 | Tragic 6.4% |