Norwegian vs Immigrants from Mexico Female Unemployment
COMPARE
Norwegian
Immigrants from Mexico
Female Unemployment
Female Unemployment Comparison
Norwegians
Immigrants from Mexico
4.2%
FEMALE UNEMPLOYMENT
100.0/ 100
METRIC RATING
1st/ 347
METRIC RANK
6.3%
FEMALE UNEMPLOYMENT
0.0/ 100
METRIC RATING
311th/ 347
METRIC RANK
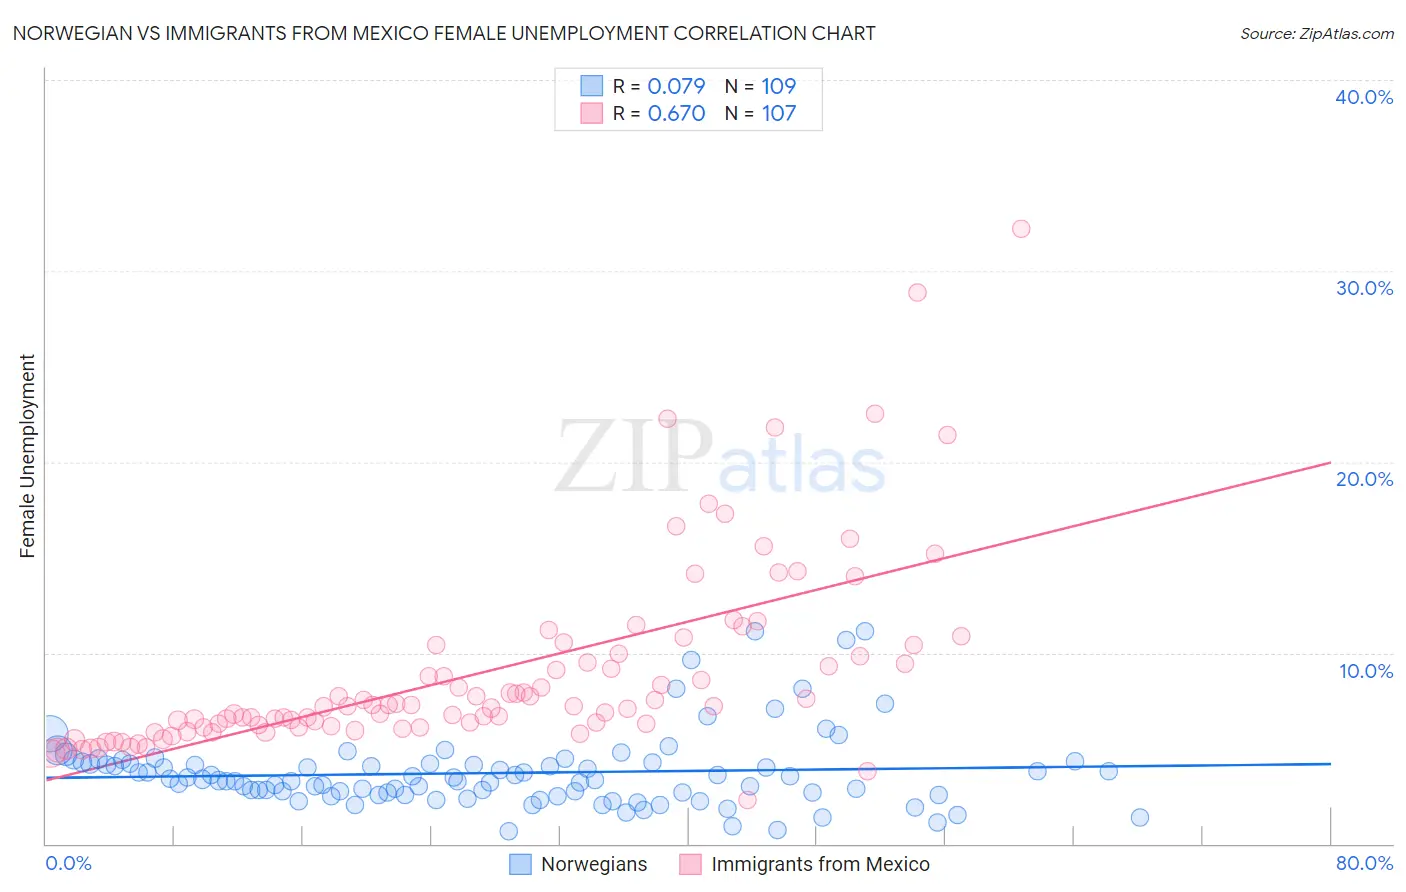
Norwegian vs Immigrants from Mexico Female Unemployment Correlation Chart
The statistical analysis conducted on geographies consisting of 523,312,817 people shows a slight positive correlation between the proportion of Norwegians and unemploymnet rate among females in the United States with a correlation coefficient (R) of 0.079 and weighted average of 4.2%. Similarly, the statistical analysis conducted on geographies consisting of 506,833,081 people shows a significant positive correlation between the proportion of Immigrants from Mexico and unemploymnet rate among females in the United States with a correlation coefficient (R) of 0.670 and weighted average of 6.3%, a difference of 51.3%.
Female Unemployment Correlation Summary
| Measurement | Norwegian | Immigrants from Mexico |
| Minimum | 0.68% | 2.3% |
| Maximum | 11.1% | 32.2% |
| Range | 10.4% | 29.9% |
| Mean | 3.7% | 9.0% |
| Median | 3.3% | 7.2% |
| Interquartile 25% (IQ1) | 2.6% | 6.1% |
| Interquartile 75% (IQ3) | 4.2% | 9.9% |
| Interquartile Range (IQR) | 1.6% | 3.8% |
| Standard Deviation (Sample) | 1.9% | 5.0% |
| Standard Deviation (Population) | 1.9% | 5.0% |
Similar Demographics by Female Unemployment
Demographics Similar to Norwegians by Female Unemployment
In terms of female unemployment, the demographic groups most similar to Norwegians are Czech (4.4%, a difference of 5.3%), Luxembourger (4.4%, a difference of 5.3%), Danish (4.4%, a difference of 5.4%), Hmong (4.4%, a difference of 5.5%), and Swedish (4.4%, a difference of 6.8%).
| Demographics | Rating | Rank | Female Unemployment |
| Norwegians | 100.0 /100 | #1 | Exceptional 4.2% |
| Czechs | 100.0 /100 | #2 | Exceptional 4.4% |
| Luxembourgers | 100.0 /100 | #3 | Exceptional 4.4% |
| Danes | 100.0 /100 | #4 | Exceptional 4.4% |
| Hmong | 100.0 /100 | #5 | Exceptional 4.4% |
| Swedes | 100.0 /100 | #6 | Exceptional 4.4% |
| Chinese | 100.0 /100 | #7 | Exceptional 4.5% |
| Germans | 100.0 /100 | #8 | Exceptional 4.5% |
| Slovenes | 100.0 /100 | #9 | Exceptional 4.5% |
| Swiss | 100.0 /100 | #10 | Exceptional 4.6% |
| Scandinavians | 100.0 /100 | #11 | Exceptional 4.6% |
| Dutch | 100.0 /100 | #12 | Exceptional 4.6% |
| Belgians | 100.0 /100 | #13 | Exceptional 4.6% |
| Finns | 100.0 /100 | #14 | Exceptional 4.6% |
| English | 100.0 /100 | #15 | Exceptional 4.6% |
Demographics Similar to Immigrants from Mexico by Female Unemployment
In terms of female unemployment, the demographic groups most similar to Immigrants from Mexico are Central American Indian (6.3%, a difference of 0.13%), Ecuadorian (6.3%, a difference of 0.54%), Immigrants from Grenada (6.3%, a difference of 0.66%), Belizean (6.3%, a difference of 0.67%), and Immigrants from Ecuador (6.4%, a difference of 0.90%).
| Demographics | Rating | Rank | Female Unemployment |
| Immigrants | Jamaica | 0.0 /100 | #304 | Tragic 6.2% |
| Spanish American Indians | 0.0 /100 | #305 | Tragic 6.2% |
| Immigrants | Central America | 0.0 /100 | #306 | Tragic 6.2% |
| Shoshone | 0.0 /100 | #307 | Tragic 6.2% |
| Hispanics or Latinos | 0.0 /100 | #308 | Tragic 6.2% |
| Ecuadorians | 0.0 /100 | #309 | Tragic 6.3% |
| Central American Indians | 0.0 /100 | #310 | Tragic 6.3% |
| Immigrants | Mexico | 0.0 /100 | #311 | Tragic 6.3% |
| Immigrants | Grenada | 0.0 /100 | #312 | Tragic 6.3% |
| Belizeans | 0.0 /100 | #313 | Tragic 6.3% |
| Immigrants | Ecuador | 0.0 /100 | #314 | Tragic 6.4% |
| Pueblo | 0.0 /100 | #315 | Tragic 6.4% |
| Houma | 0.0 /100 | #316 | Tragic 6.4% |
| Immigrants | St. Vincent and the Grenadines | 0.0 /100 | #317 | Tragic 6.4% |
| British West Indians | 0.0 /100 | #318 | Tragic 6.4% |