Immigrants from Bosnia and Herzegovina vs Native Hawaiian Unemployment
COMPARE
Immigrants from Bosnia and Herzegovina
Native Hawaiian
Unemployment
Unemployment Comparison
Immigrants from Bosnia and Herzegovina
Native Hawaiians
4.8%
UNEMPLOYMENT
99.7/ 100
METRIC RATING
41st/ 347
METRIC RANK
5.3%
UNEMPLOYMENT
24.1/ 100
METRIC RATING
205th/ 347
METRIC RANK
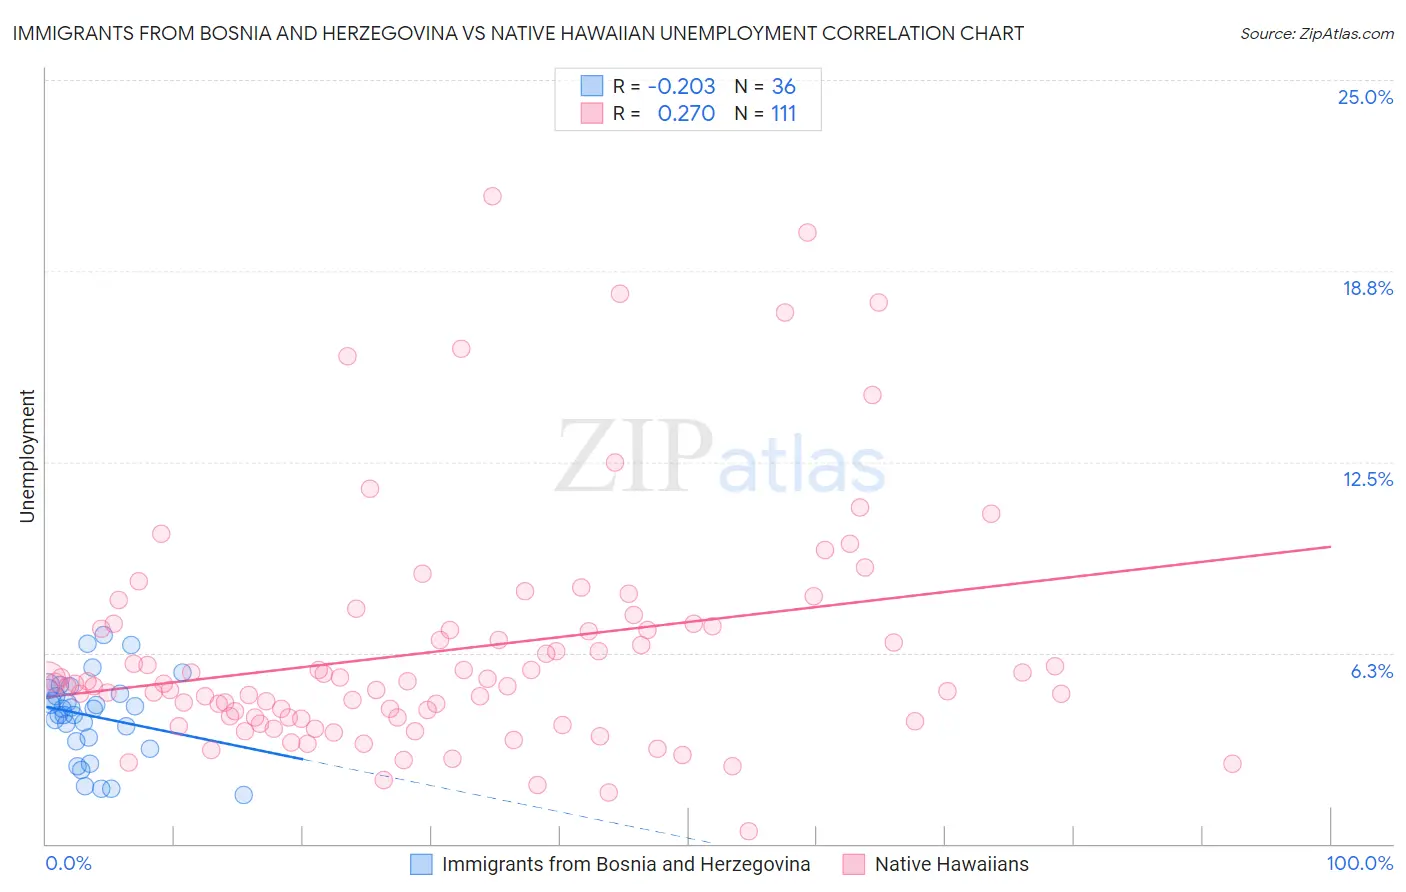
Immigrants from Bosnia and Herzegovina vs Native Hawaiian Unemployment Correlation Chart
The statistical analysis conducted on geographies consisting of 156,781,298 people shows a weak negative correlation between the proportion of Immigrants from Bosnia and Herzegovina and unemployment in the United States with a correlation coefficient (R) of -0.203 and weighted average of 4.8%. Similarly, the statistical analysis conducted on geographies consisting of 331,714,087 people shows a weak positive correlation between the proportion of Native Hawaiians and unemployment in the United States with a correlation coefficient (R) of 0.270 and weighted average of 5.3%, a difference of 11.5%.
Unemployment Correlation Summary
| Measurement | Immigrants from Bosnia and Herzegovina | Native Hawaiian |
| Minimum | 1.6% | 0.40% |
| Maximum | 6.8% | 21.2% |
| Range | 5.2% | 20.8% |
| Mean | 4.2% | 6.3% |
| Median | 4.4% | 5.3% |
| Interquartile 25% (IQ1) | 3.4% | 4.1% |
| Interquartile 75% (IQ3) | 5.0% | 7.1% |
| Interquartile Range (IQR) | 1.6% | 3.0% |
| Standard Deviation (Sample) | 1.3% | 3.9% |
| Standard Deviation (Population) | 1.3% | 3.8% |
Similar Demographics by Unemployment
Demographics Similar to Immigrants from Bosnia and Herzegovina by Unemployment
In terms of unemployment, the demographic groups most similar to Immigrants from Bosnia and Herzegovina are Northern European (4.8%, a difference of 0.030%), Lithuanian (4.8%, a difference of 0.040%), Bolivian (4.8%, a difference of 0.19%), Czechoslovakian (4.8%, a difference of 0.38%), and Tongan (4.8%, a difference of 0.45%).
| Demographics | Rating | Rank | Unemployment |
| Immigrants | Bolivia | 99.8 /100 | #34 | Exceptional 4.8% |
| Scotch-Irish | 99.8 /100 | #35 | Exceptional 4.8% |
| Tongans | 99.7 /100 | #36 | Exceptional 4.8% |
| Czechoslovakians | 99.7 /100 | #37 | Exceptional 4.8% |
| Bolivians | 99.7 /100 | #38 | Exceptional 4.8% |
| Lithuanians | 99.7 /100 | #39 | Exceptional 4.8% |
| Northern Europeans | 99.7 /100 | #40 | Exceptional 4.8% |
| Immigrants | Bosnia and Herzegovina | 99.7 /100 | #41 | Exceptional 4.8% |
| Filipinos | 99.5 /100 | #42 | Exceptional 4.8% |
| Yugoslavians | 99.5 /100 | #43 | Exceptional 4.8% |
| Austrians | 99.5 /100 | #44 | Exceptional 4.8% |
| French | 99.5 /100 | #45 | Exceptional 4.8% |
| Immigrants | Nepal | 99.4 /100 | #46 | Exceptional 4.8% |
| Immigrants | Taiwan | 99.4 /100 | #47 | Exceptional 4.8% |
| Immigrants | Scotland | 99.3 /100 | #48 | Exceptional 4.9% |
Demographics Similar to Native Hawaiians by Unemployment
In terms of unemployment, the demographic groups most similar to Native Hawaiians are Immigrants from Ukraine (5.3%, a difference of 0.060%), Immigrants from Micronesia (5.3%, a difference of 0.080%), Cherokee (5.3%, a difference of 0.11%), Immigrants from Peru (5.4%, a difference of 0.13%), and Immigrants from South Eastern Asia (5.3%, a difference of 0.23%).
| Demographics | Rating | Rank | Unemployment |
| Immigrants | Israel | 28.6 /100 | #198 | Fair 5.3% |
| Immigrants | Afghanistan | 28.6 /100 | #199 | Fair 5.3% |
| Koreans | 27.4 /100 | #200 | Fair 5.3% |
| Immigrants | South Eastern Asia | 27.0 /100 | #201 | Fair 5.3% |
| Cherokee | 25.5 /100 | #202 | Fair 5.3% |
| Immigrants | Micronesia | 25.2 /100 | #203 | Fair 5.3% |
| Immigrants | Ukraine | 24.9 /100 | #204 | Fair 5.3% |
| Native Hawaiians | 24.1 /100 | #205 | Fair 5.3% |
| Immigrants | Peru | 22.7 /100 | #206 | Fair 5.4% |
| Creek | 19.4 /100 | #207 | Poor 5.4% |
| Portuguese | 19.0 /100 | #208 | Poor 5.4% |
| Immigrants | Iran | 18.8 /100 | #209 | Poor 5.4% |
| Immigrants | Iraq | 18.6 /100 | #210 | Poor 5.4% |
| Iraqis | 18.1 /100 | #211 | Poor 5.4% |
| Ugandans | 18.0 /100 | #212 | Poor 5.4% |