Barbadian vs Immigrants from Cambodia Median Household Income
COMPARE
Barbadian
Immigrants from Cambodia
Median Household Income
Median Household Income Comparison
Barbadians
Immigrants from Cambodia
$79,664
MEDIAN HOUSEHOLD INCOME
3.0/ 100
METRIC RATING
238th/ 347
METRIC RANK
$83,304
MEDIAN HOUSEHOLD INCOME
24.0/ 100
METRIC RATING
203rd/ 347
METRIC RANK
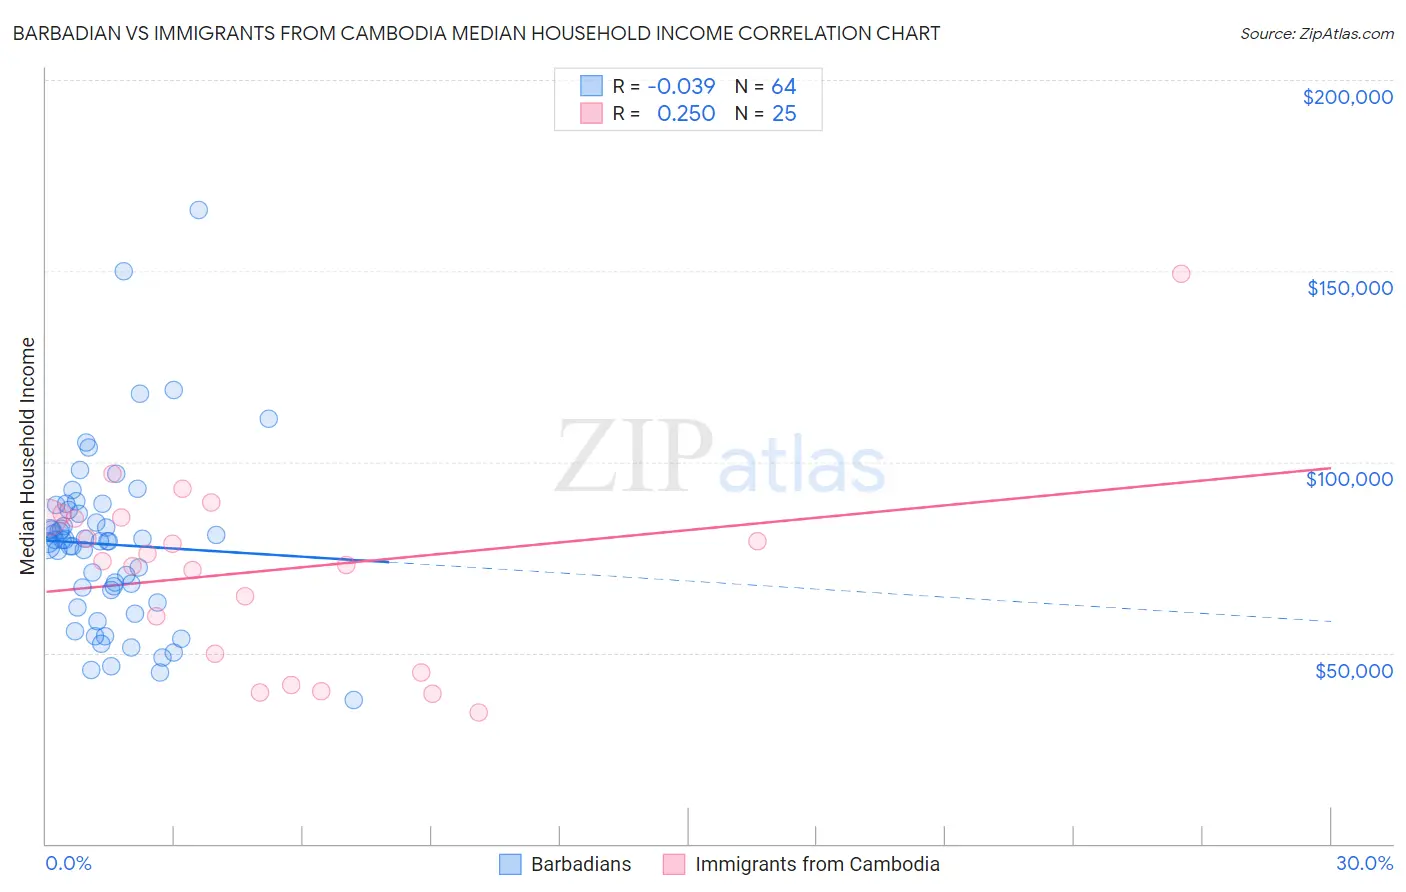
Barbadian vs Immigrants from Cambodia Median Household Income Correlation Chart
The statistical analysis conducted on geographies consisting of 141,253,267 people shows no correlation between the proportion of Barbadians and median household income in the United States with a correlation coefficient (R) of -0.039 and weighted average of $79,664. Similarly, the statistical analysis conducted on geographies consisting of 205,122,161 people shows a weak positive correlation between the proportion of Immigrants from Cambodia and median household income in the United States with a correlation coefficient (R) of 0.250 and weighted average of $83,304, a difference of 4.6%.
Median Household Income Correlation Summary
| Measurement | Barbadian | Immigrants from Cambodia |
| Minimum | $37,500 | $34,518 |
| Maximum | $166,111 | $149,239 |
| Range | $128,611 | $114,721 |
| Mean | $78,382 | $71,594 |
| Median | $79,225 | $73,842 |
| Interquartile 25% (IQ1) | $64,694 | $47,361 |
| Interquartile 75% (IQ3) | $86,916 | $85,484 |
| Interquartile Range (IQR) | $22,222 | $38,123 |
| Standard Deviation (Sample) | $22,744 | $25,130 |
| Standard Deviation (Population) | $22,565 | $24,622 |
Similar Demographics by Median Household Income
Demographics Similar to Barbadians by Median Household Income
In terms of median household income, the demographic groups most similar to Barbadians are Nicaraguan ($79,737, a difference of 0.090%), Alaska Native ($79,509, a difference of 0.20%), Immigrants from Western Africa ($79,490, a difference of 0.22%), Immigrants from Bosnia and Herzegovina ($79,888, a difference of 0.28%), and Nonimmigrants ($79,429, a difference of 0.30%).
| Demographics | Rating | Rank | Median Household Income |
| Trinidadians and Tobagonians | 4.7 /100 | #231 | Tragic $80,402 |
| Immigrants | Trinidad and Tobago | 4.6 /100 | #232 | Tragic $80,373 |
| Immigrants | Azores | 4.5 /100 | #233 | Tragic $80,357 |
| Immigrants | Ecuador | 4.5 /100 | #234 | Tragic $80,341 |
| Immigrants | Guyana | 4.5 /100 | #235 | Tragic $80,324 |
| Immigrants | Bosnia and Herzegovina | 3.4 /100 | #236 | Tragic $79,888 |
| Nicaraguans | 3.1 /100 | #237 | Tragic $79,737 |
| Barbadians | 3.0 /100 | #238 | Tragic $79,664 |
| Alaska Natives | 2.7 /100 | #239 | Tragic $79,509 |
| Immigrants | Western Africa | 2.7 /100 | #240 | Tragic $79,490 |
| Immigrants | Nonimmigrants | 2.6 /100 | #241 | Tragic $79,429 |
| Immigrants | Sudan | 2.1 /100 | #242 | Tragic $79,103 |
| Immigrants | Barbados | 1.9 /100 | #243 | Tragic $78,989 |
| Marshallese | 1.9 /100 | #244 | Tragic $78,930 |
| Inupiat | 1.8 /100 | #245 | Tragic $78,841 |
Demographics Similar to Immigrants from Cambodia by Median Household Income
In terms of median household income, the demographic groups most similar to Immigrants from Cambodia are Immigrants from Africa ($83,289, a difference of 0.020%), Immigrants from Thailand ($83,327, a difference of 0.030%), Tsimshian ($83,346, a difference of 0.050%), Spanish ($83,343, a difference of 0.050%), and German ($83,358, a difference of 0.070%).
| Demographics | Rating | Rank | Median Household Income |
| French | 26.0 /100 | #196 | Fair $83,468 |
| Aleuts | 25.7 /100 | #197 | Fair $83,446 |
| Japanese | 25.1 /100 | #198 | Fair $83,395 |
| Germans | 24.6 /100 | #199 | Fair $83,358 |
| Tsimshian | 24.5 /100 | #200 | Fair $83,346 |
| Spanish | 24.4 /100 | #201 | Fair $83,343 |
| Immigrants | Thailand | 24.3 /100 | #202 | Fair $83,327 |
| Immigrants | Cambodia | 24.0 /100 | #203 | Fair $83,304 |
| Immigrants | Africa | 23.8 /100 | #204 | Fair $83,289 |
| Celtics | 22.7 /100 | #205 | Fair $83,193 |
| Immigrants | Kenya | 21.3 /100 | #206 | Fair $83,068 |
| Dutch | 20.3 /100 | #207 | Fair $82,971 |
| French Canadians | 18.7 /100 | #208 | Poor $82,810 |
| Immigrants | Iraq | 16.7 /100 | #209 | Poor $82,594 |
| Immigrants | Uruguay | 16.4 /100 | #210 | Poor $82,560 |